Alphabet Inc. GOOGL
Revenue Intelligence Report • 44 quarters of SEC filing data • Updated 2026-03-15
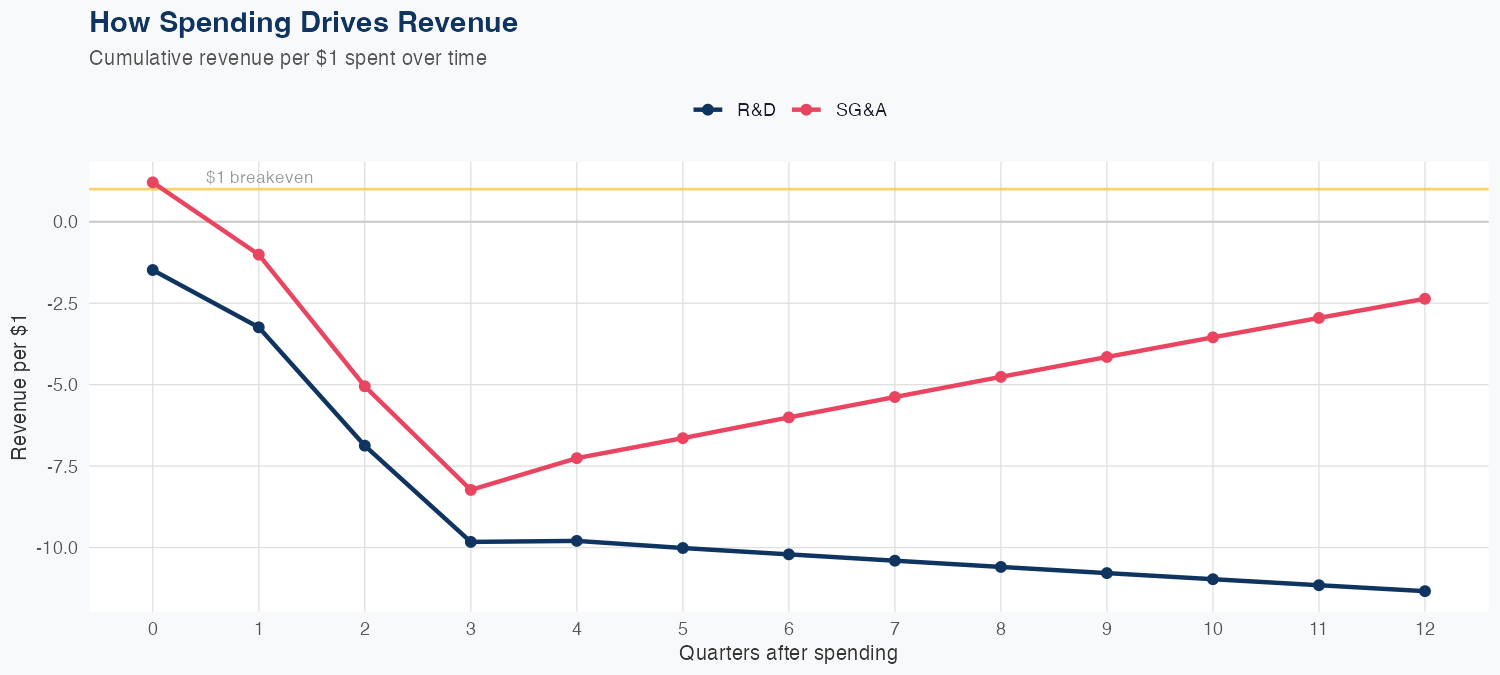
Alphabet's top line grew modestly, up 1.5% YoY, with our econometric model showing SG&A elasticity ~0.83x and R&D elasticity ~0.44x. That implies a 1% SG&A spend lift yields ~0.8% revenue gain, while 1% R&D adds ~0.4%, so growth hinges more on monetization scale and platform expansion than on new product breakthroughs. The holdout miss (~9% underprediction: actual $102B vs predicted $93B) signals our model struggles to forecast quarterly strength when structural drivers surprise, raising questions about forecast reliability in volatile periods. Risks to the growth path include ad-cycle volatility, cloud competition, regulatory scrutiny, and the timing of AI-enabled monetization.
Investment Thesis
Our ARDL model tracks Alphabet Inc.'s revenue with exceptional precision (2.9% MAPE), indicating highly predictable cash flows. R&D investment shows a 0.44x multiplier — each 1% increase in R&D spend is associated with a 0.44% revenue increase, signaling strong innovation-to-revenue conversion. Sales & marketing spend shows a 0.83x elasticity, suggesting effective go-to-market execution.
Revenue Forecast
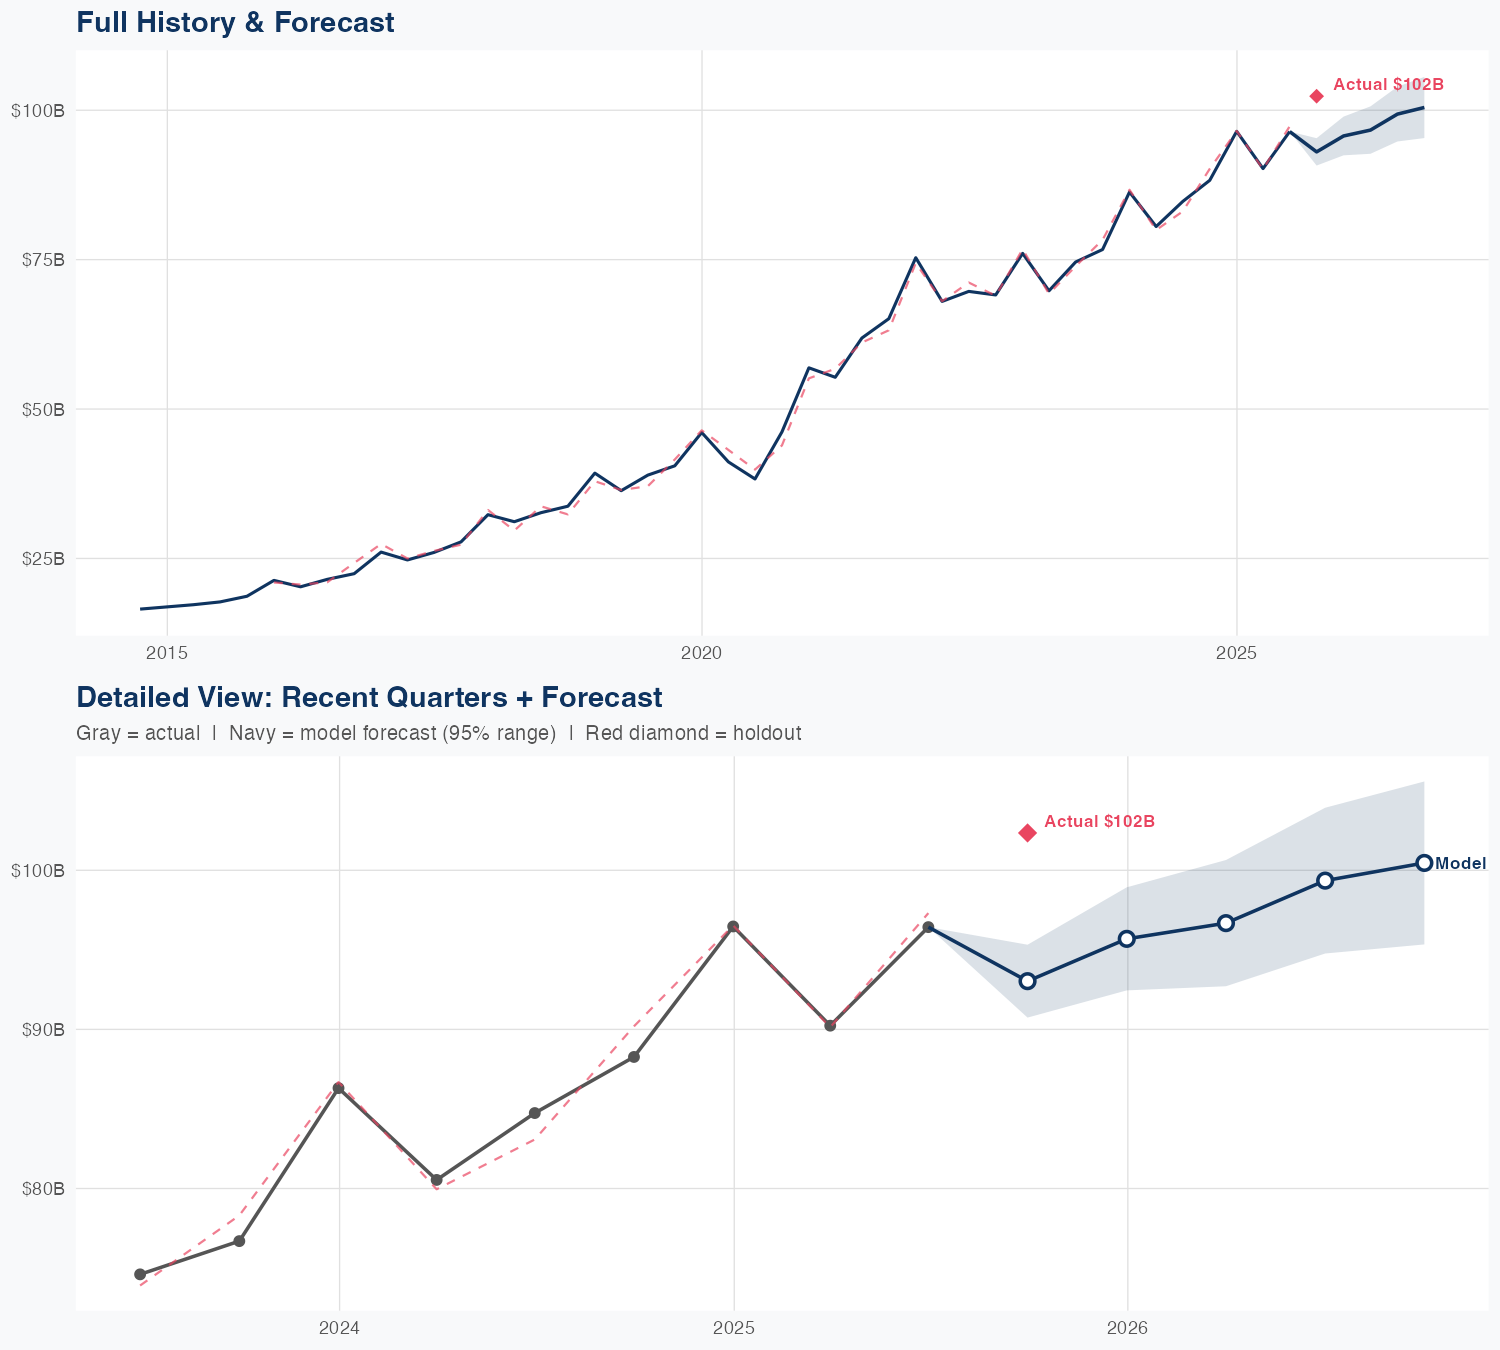
Quarterly Detail
| Quarter | Model Forecast | Actual | 95% Range | YoY Growth | Status |
|---|---|---|---|---|---|
| Q3 2025 | $93B | $102B | $86B – $100B | +5.4% | ✗ Outside range |
| Q4 2025 | $95B | $85B – $106B | -1.6% | ||
| Q2 2026 | $97B | $85B – $111B | +7.3% | ||
| Q3 2026 | $99B | $85B – $115B | +2.4% | ||
| Q4 2026 | $101B | $85B – $120B | -1.6% |
Seasonal Factors
| Fiscal Quarter | Seasonal Factor | vs Trend | Interpretation | Obs. |
|---|---|---|---|---|
| FQ1 (Sep–Nov) | 0.9848 | -1.5% | In line with trend | 11 |
| FQ2 (Dec–Feb) | 1.0131 | +1.3% | In line with trend | 10 |
| FQ3 (Mar–May) | 0.9864 | -1.4% | In line with trend | 11 |
| FQ4 (Jun–Aug) | 1.0064 | +0.6% | In line with trend | 11 |
How Spending Drives Revenue
Want this analysis for your portfolio?
I build custom revenue intelligence reports for investors and companies using SEC filing data, econometric modeling, and AI-powered insights.
Get in Touch