Hewlett Packard Enterprise Company HPE
Revenue Intelligence Report • 36 quarters of SEC filing data • Updated 2026-03-15
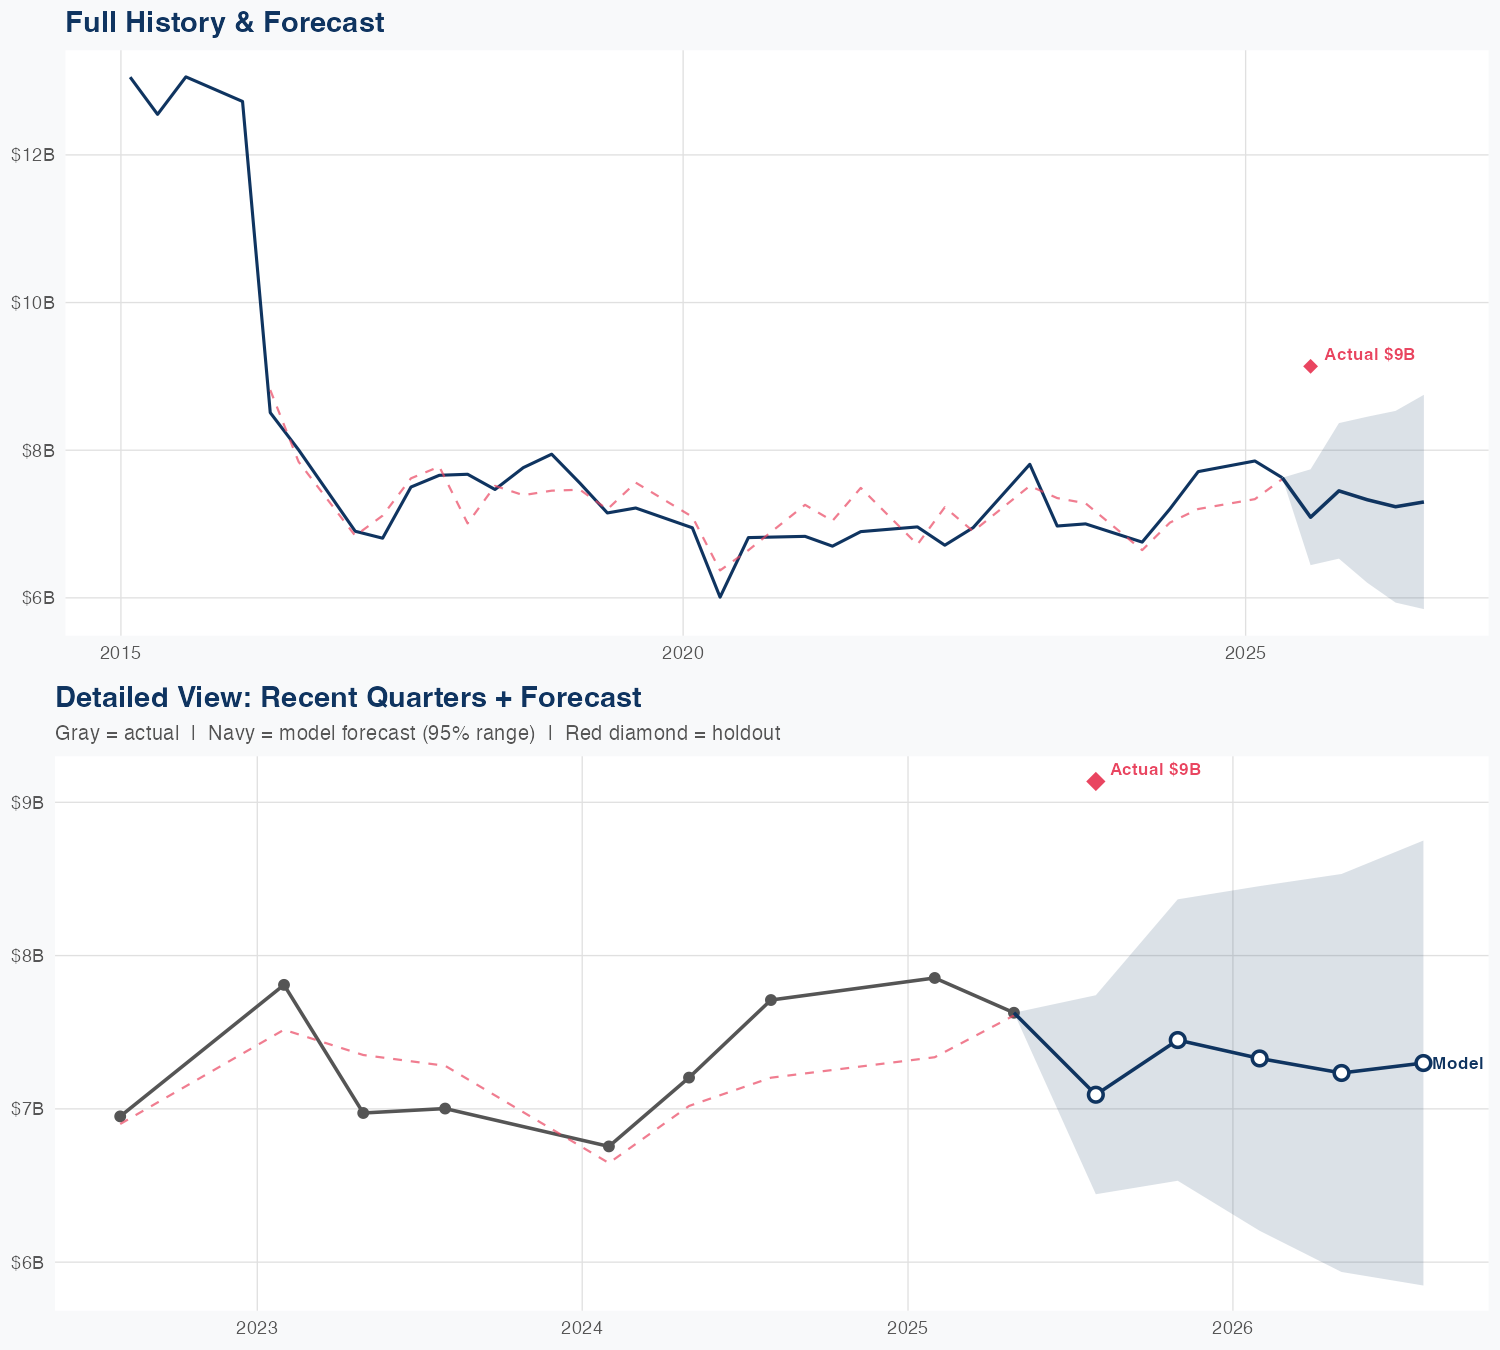
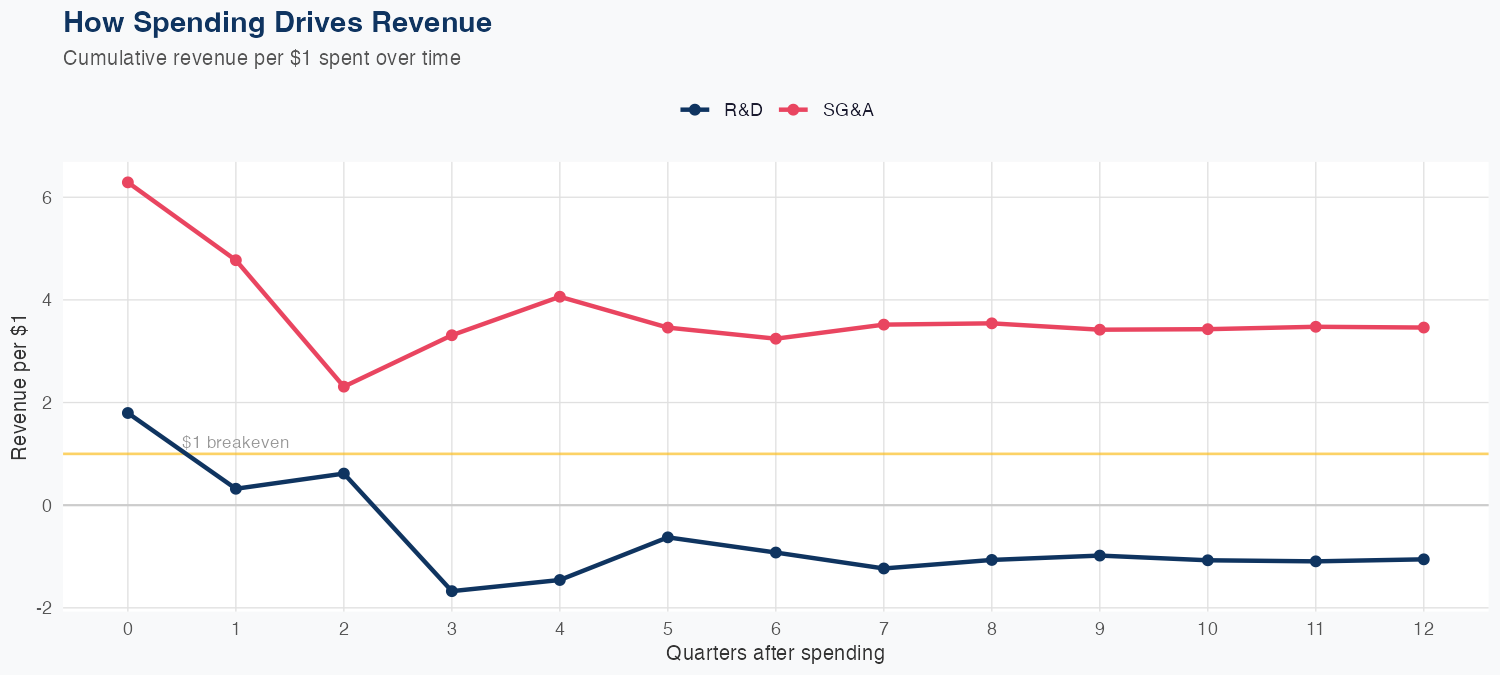
Latest quarterly revenue was $9.301B, with a 36-quarter data history underpinning the model. The model attributes revenue growth primarily to SG&A spending, delivering about $2.99 in long-run revenue for every $1 of SG&A, while R&D spending carries a negative long-run impact of about $-1.06 per $1. The modeling approach is linear and shows a 4.0% MAPE in-sample, but a holdout test produced a 15.1% error (predicted $7.9B vs actual $9.3B), signaling caution on near-term forecasts. FY revenue is forecast at $31B, down 7.6% year over year, indicating headwinds ahead; investors should weigh the favorable ROI on SG&A relative to the negative R&D signal against the modest near-term outlook.
Investment Thesis
The econometric model achieves strong accuracy (4.0% MAPE), suggesting Hewlett Packard Enterprise Company's revenue trajectory is well-characterized by its spending patterns. Each $1 of SG&A spending generates $2.99 in revenue, reflecting strong commercial efficiency.
Revenue Forecast
Quarterly Detail
| Quarter | Model Forecast | Actual | 95% Range | YoY Growth | Status |
|---|---|---|---|---|---|
| Q4 2025 | $7.9B | $9.3B | $7.2B – $8.6B | +2.4% | ✗ Outside range |
| Q1 2026 | $7.7B | $6.7B – $8.7B | -2.2% | ||
| Q2 2026 | $7.7B | $6.5B – $8.9B | +0.9% | ||
| Q3 2026 | $8.0B | $6.6B – $9.4B | -12.8% | ||
| Q4 2026 | $8.0B | $6.4B – $9.5B | -14.1% |
Seasonal Factors
| Fiscal Quarter | Seasonal Factor | vs Trend | Interpretation | Obs. |
|---|---|---|---|---|
| FQ1 (Sep–Nov) | 1.0879 | +8.8% | +8.8% above trend | 2 |
| FQ2 (Dec–Feb) | 1.0218 | +2.2% | In line with trend | 10 |
| FQ3 (Mar–May) | 0.9625 | -3.7% | -3.7% below trend | 10 |
| FQ4 (Jun–Aug) | 1.0017 | +0.2% | In line with trend | 10 |
How Spending Drives Revenue
Want this analysis for your portfolio?
I build custom revenue intelligence reports for investors and companies using SEC filing data, econometric modeling, and AI-powered insights.
Get in Touch