Nvidia Corp NVDA
Revenue Intelligence Report • 59 quarters of SEC filing data • Updated 2026-03-15
The model, a log-log specification, finds revenue is negatively related to R&D and positively related to SG&A: a 1% increase in R&D is associated with about a 1.05% decrease in revenue, while a 1% increase in SG&A corresponds to roughly a 0.71% revenue rise. The model’s out-of-sample performance shows limited accuracy: MAPE 10.2% and a holdout error of about 3.7% (predicted $66B vs actual $68B). From an ROI perspective, R&D appears to have negative revenue impact in this framework, while SG&A provides a positive uplift, suggesting efficiency gains would hinge on rebalancing investment toward SG&A or improving R&D effectiveness. The FY forecast of $392B revenue, up 81.5% year over year, signals a strong growth trajectory but comes with notable model uncertainty and reliance on a cost structure that may not reflect longer-term dynamics.
Investment Thesis
At 10.2% MAPE, the model captures Nvidia Corp's broad revenue trajectory, though quarterly variability suggests sensitivity to external factors. R&D spending currently shows a negative elasticity (-1.05x), which can indicate heavy investment in long-cycle initiatives not yet reflected in revenue. Sales & marketing spend shows a 0.71x elasticity, suggesting effective go-to-market execution.
Revenue Forecast
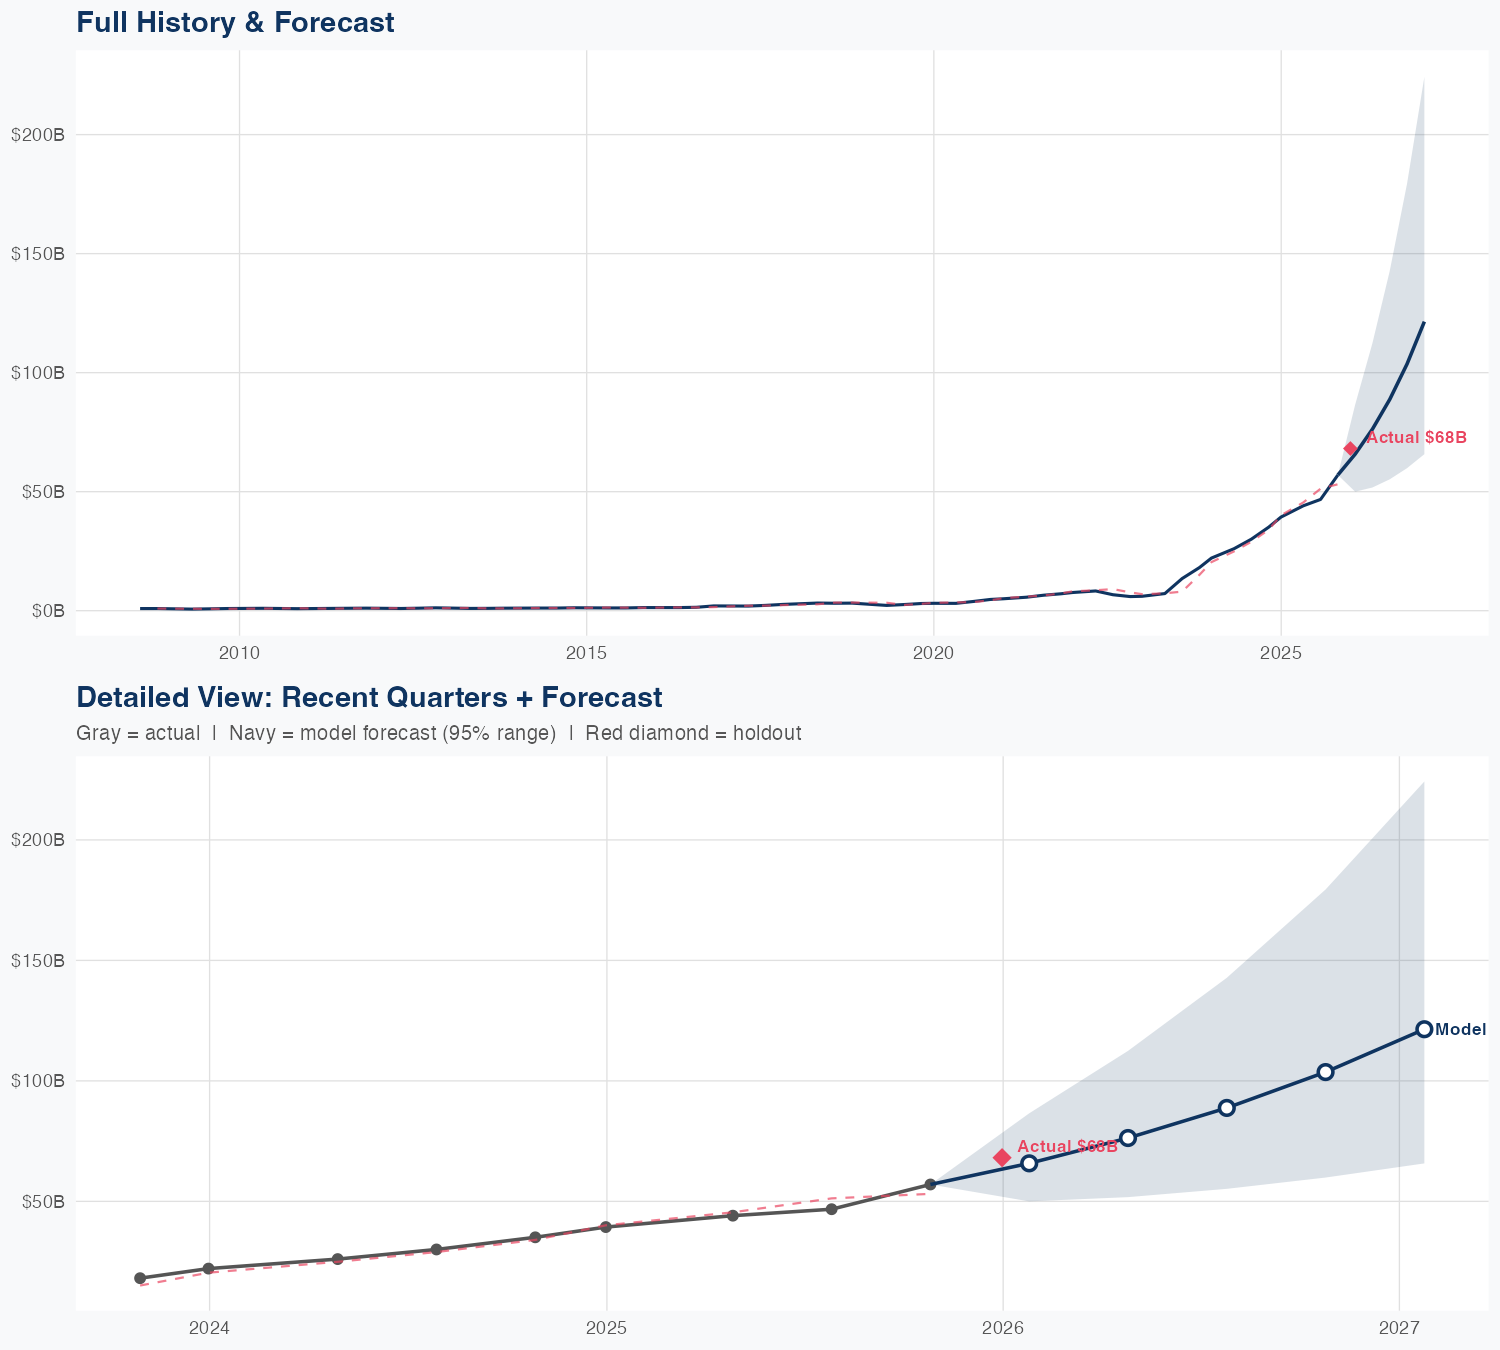
Quarterly Detail
| Quarter | Model Forecast | Actual | 95% Range | YoY Growth | Status |
|---|---|---|---|---|---|
| Q1 2026 | $66B | $68B | $50B – $86B | +66.7% | ✓ In range |
| Q2 2026 | $77B | $52B – $113B | +74.7% | ||
| Q3 2026 | $91B | $56B – $146B | +94.4% | ||
| Q4 2026 | $105B | $60B – $181B | +83.6% | ||
| Q1 2027 | $119B | $65B – $220B | +75.3% |
Seasonal Factors
| Fiscal Quarter | Seasonal Factor | vs Trend | Interpretation | Obs. |
|---|---|---|---|---|
| FQ1 (Sep–Nov) | 1.0724 | +7.2% | +7.2% above trend | 18 |
| FQ2 (Dec–Feb) | 0.947 | -5.3% | -5.3% below trend | 7 |
| FQ3 (Mar–May) | 0.9608 | -3.9% | -3.9% below trend | 17 |
| FQ4 (Jun–Aug) | 1.0314 | +3.1% | +3.1% above trend | 16 |
How Spending Drives Revenue
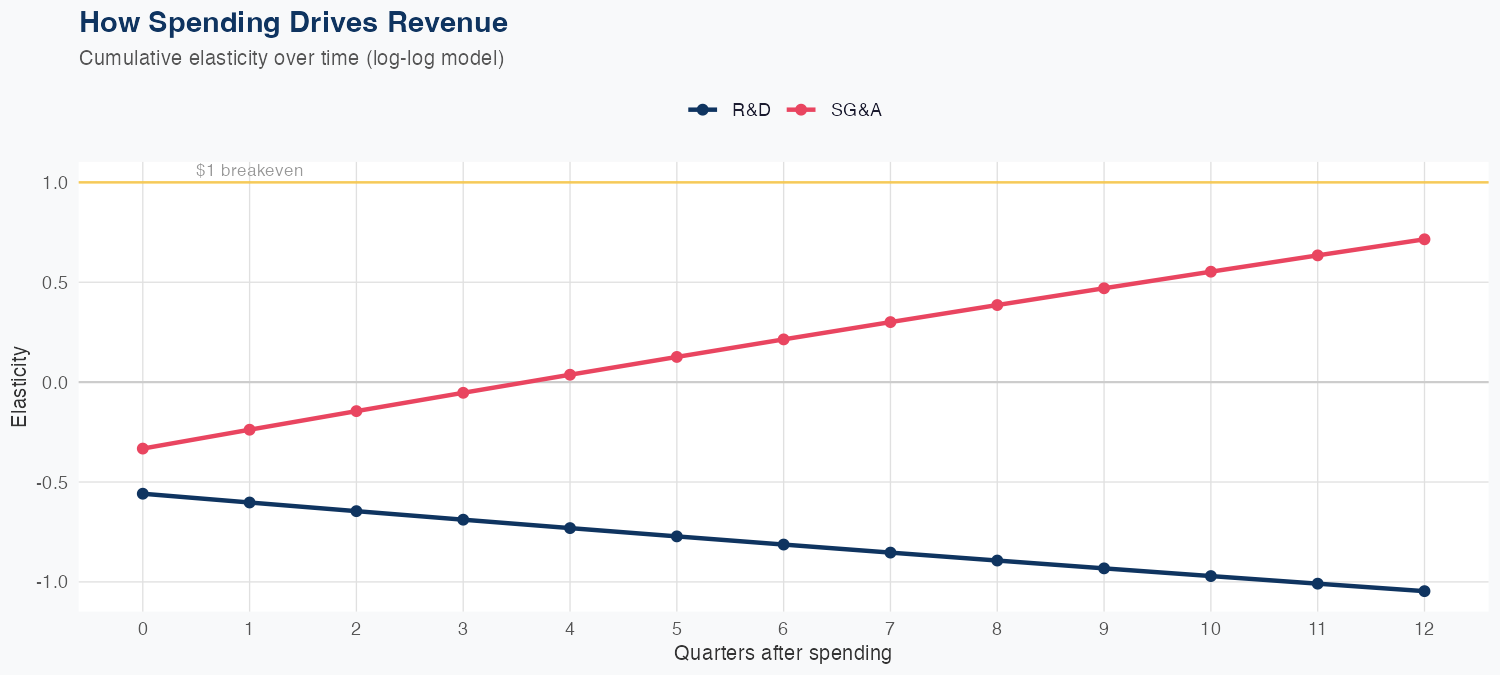
Spending Efficiency Over Time
Current SG&A elasticity: 0.2726x • R&D: 0.364x
Want this analysis for your portfolio?
I build custom revenue intelligence reports for investors and companies using SEC filing data, econometric modeling, and AI-powered insights.
Get in Touch