Oracle Corporation ORCL
Revenue Intelligence Report • 48 quarters of SEC filing data • Updated 2026-03-15
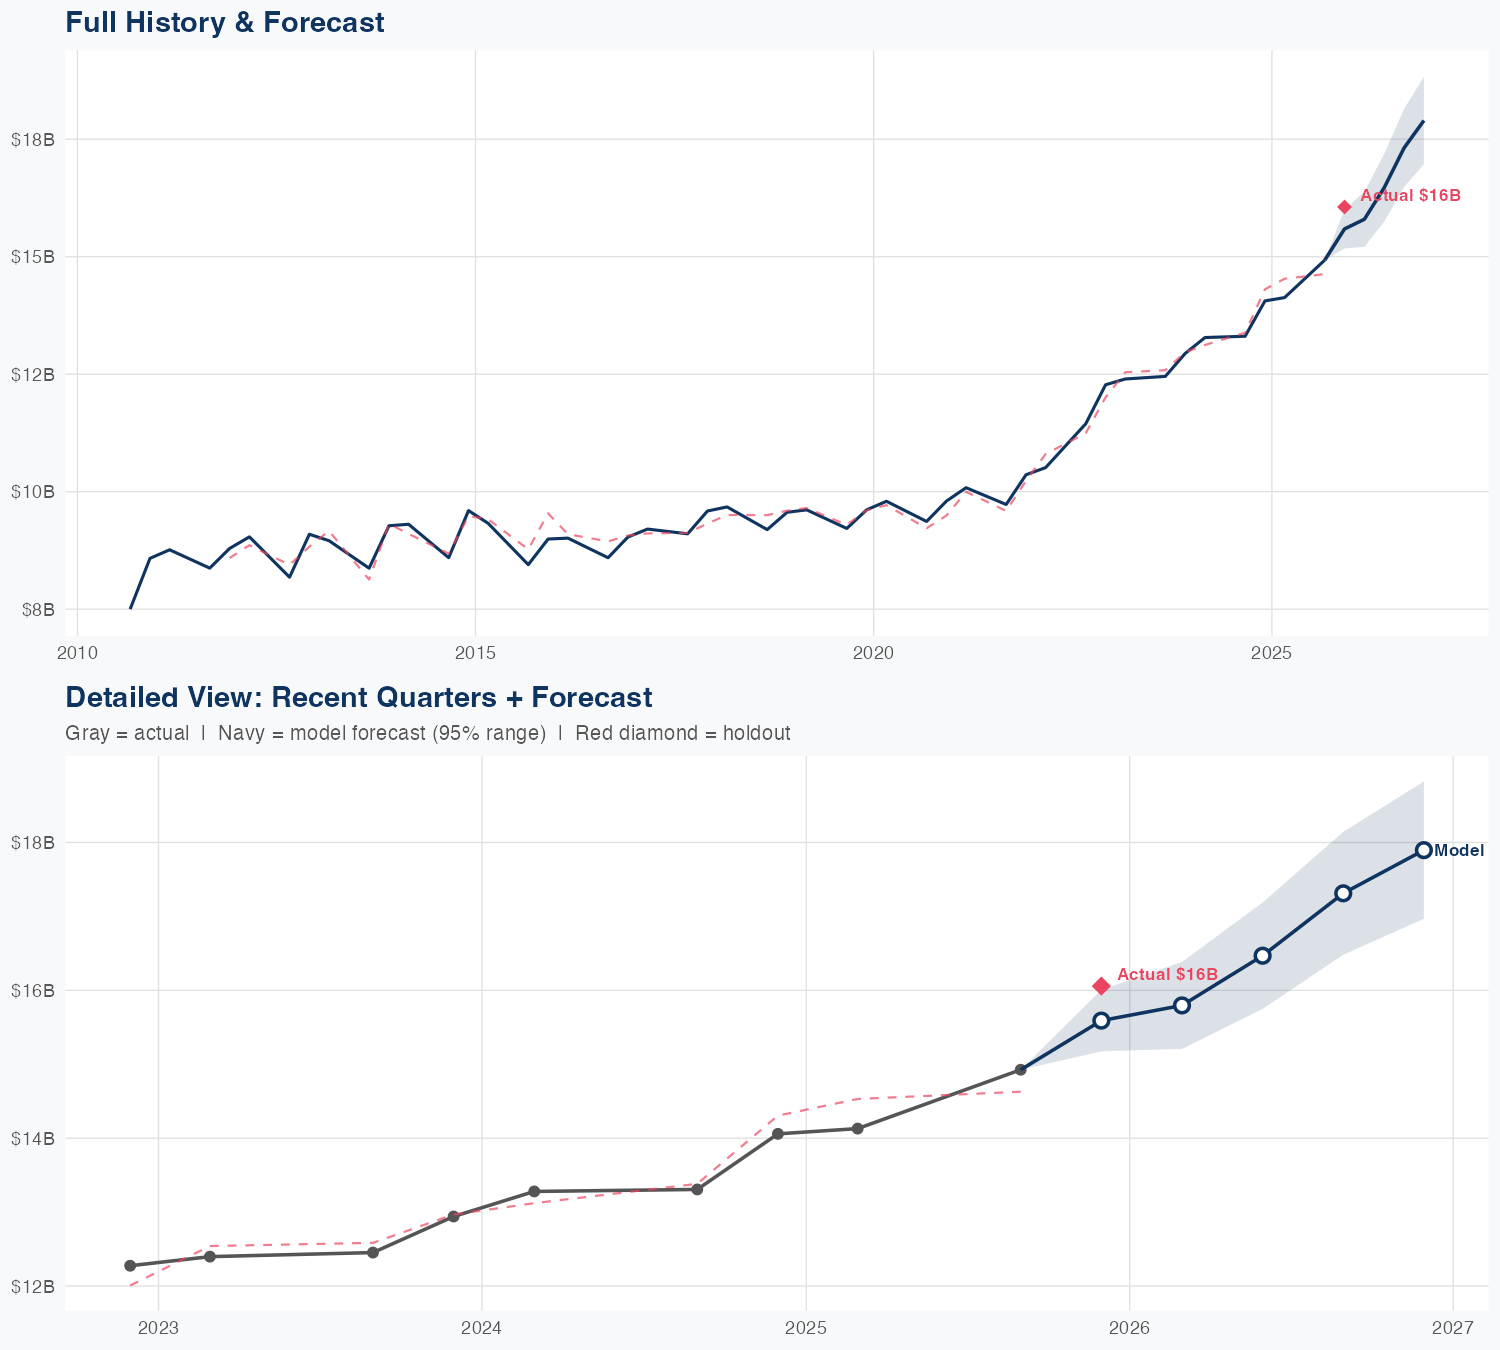
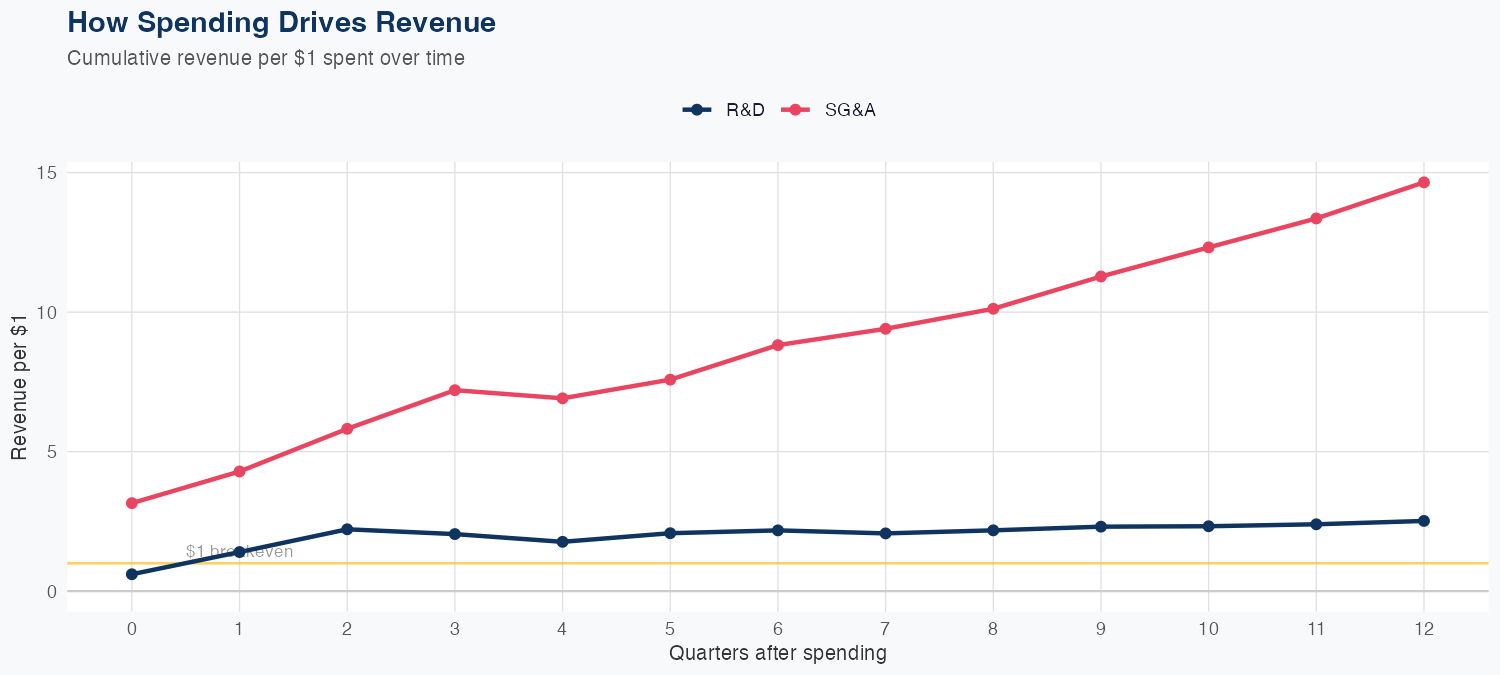
The revenue model identifies SG&A investments as the primary driver, with a 1% rise in SG&A associated with a 3.31% lift in revenue, while R&D shows a negative elasticity of -0.61% per 1% increase. The model is a log-log specification with 2.1% MAPE, and a holdout test predicted the latest quarter at about $17.0B versus actual $17.19B, a 2.5% error, indicating solid near-term accuracy. The most recent quarterly revenue printed at $17.19B, confirming the current scale of operations. The FY outlook projects $81B in revenue, up about 29.7% year over year, signaling a strong growth trajectory driven by SG&A-led momentum, with R&D still yielding limited incremental revenue in this framework and potential optimization opportunities.
Investment Thesis
Our ARDL model tracks Oracle Corporation's revenue with exceptional precision (2.1% MAPE), indicating highly predictable cash flows. R&D spending currently shows a negative elasticity (-0.61x), which can indicate heavy investment in long-cycle initiatives not yet reflected in revenue. Sales & marketing spend shows a 3.31x elasticity, suggesting effective go-to-market execution.
Revenue Forecast
Quarterly Detail
| Quarter | Model Forecast | Actual | 95% Range | YoY Growth | Status |
|---|---|---|---|---|---|
| Q1 2026 | $17B | $17B | $16B – $18B | +19.2% | ✓ In range |
| Q2 2026 | $18B | $17B – $19B | +26.5% | ||
| Q3 2026 | $19B | $18B – $21B | +29.3% | ||
| Q4 2026 | $21B | $19B – $23B | +29.8% | ||
| Q1 2027 | $23B | $20B – $25B | +32.6% |
Seasonal Factors
| Fiscal Quarter | Seasonal Factor | vs Trend | Interpretation | Obs. |
|---|---|---|---|---|
| FQ1 (Sep–Nov) | 1.0156 | +1.6% | In line with trend | 15 |
| FQ2 (Dec–Feb) | 1.0028 | +0.3% | In line with trend | 15 |
| FQ3 (Mar–May) | 1.0 | +0.0% | In line with trend | 0 |
| FQ4 (Jun–Aug) | 1.0022 | +0.2% | In line with trend | 15 |
How Spending Drives Revenue
Want this analysis for your portfolio?
I build custom revenue intelligence reports for investors and companies using SEC filing data, econometric modeling, and AI-powered insights.
Get in Touch