Paycom Software, Inc. PAYC
Revenue Intelligence Report • 44 quarters of SEC filing data • Updated 2026-03-15
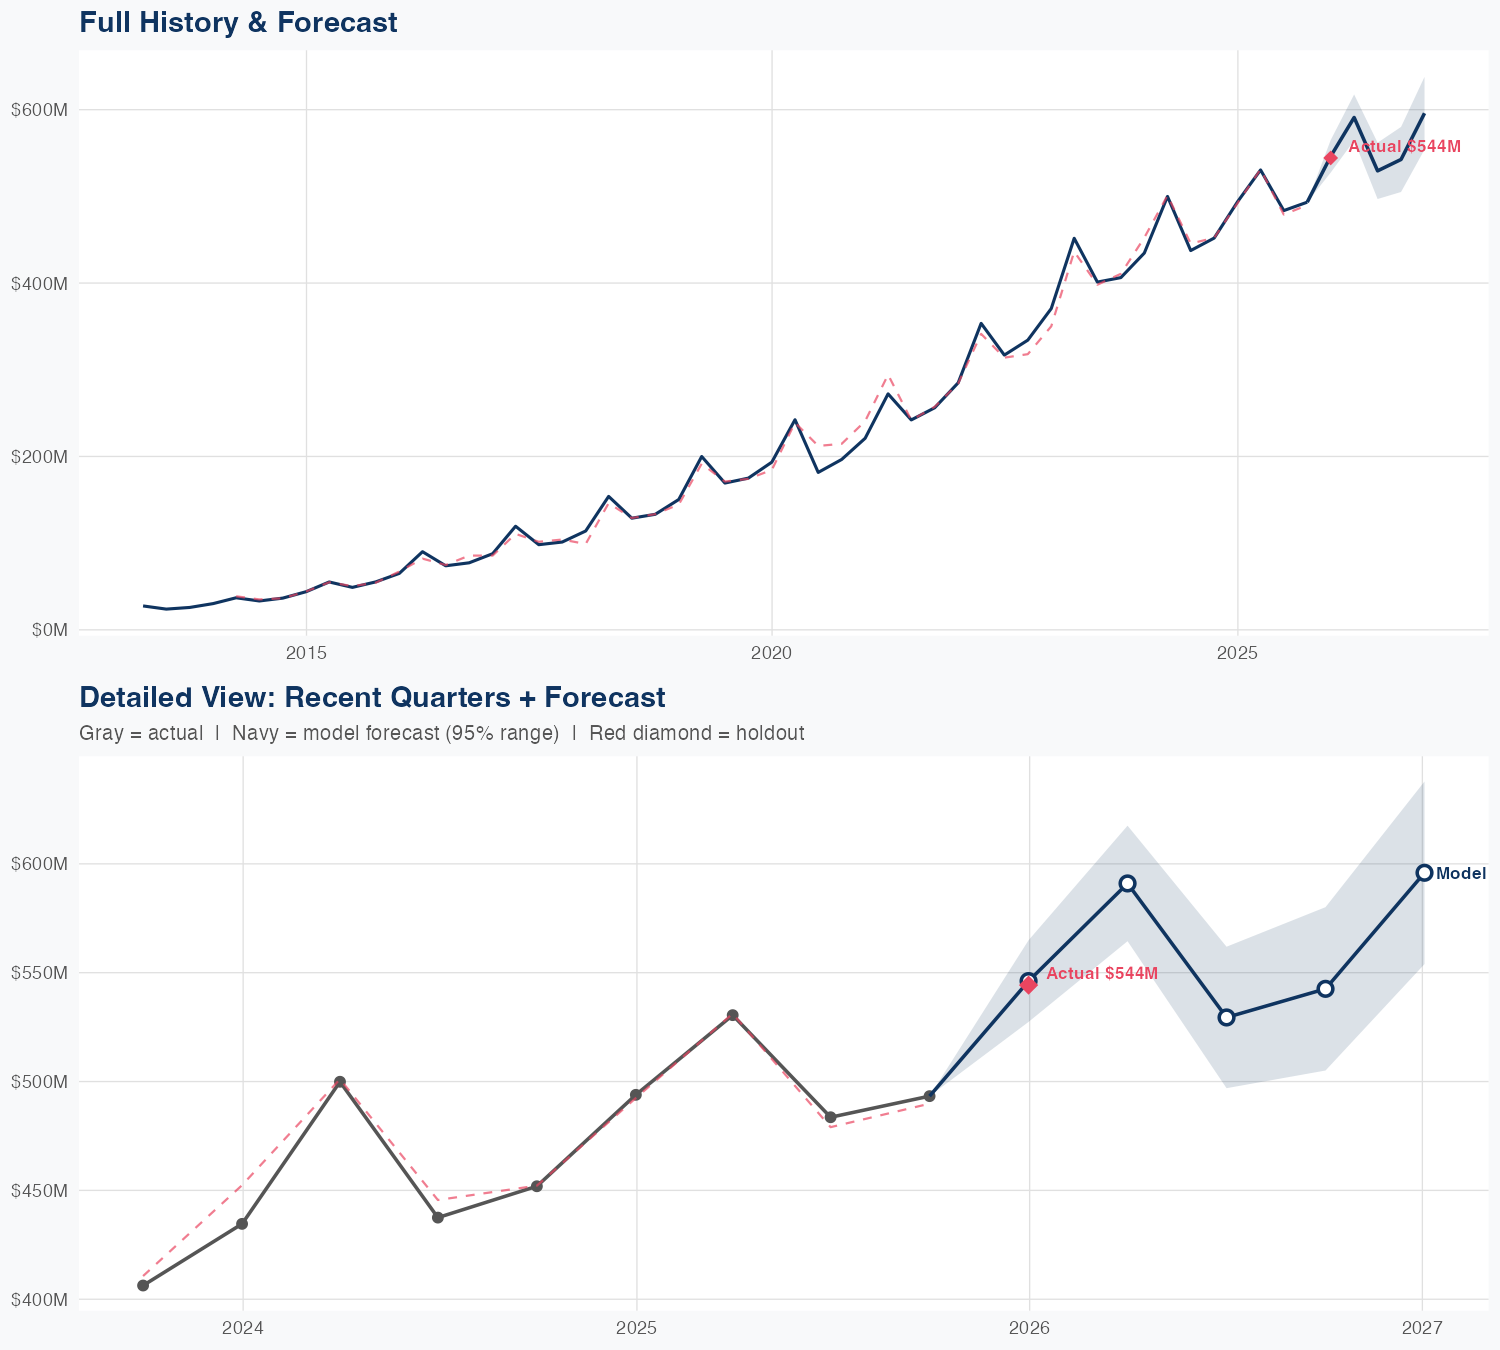
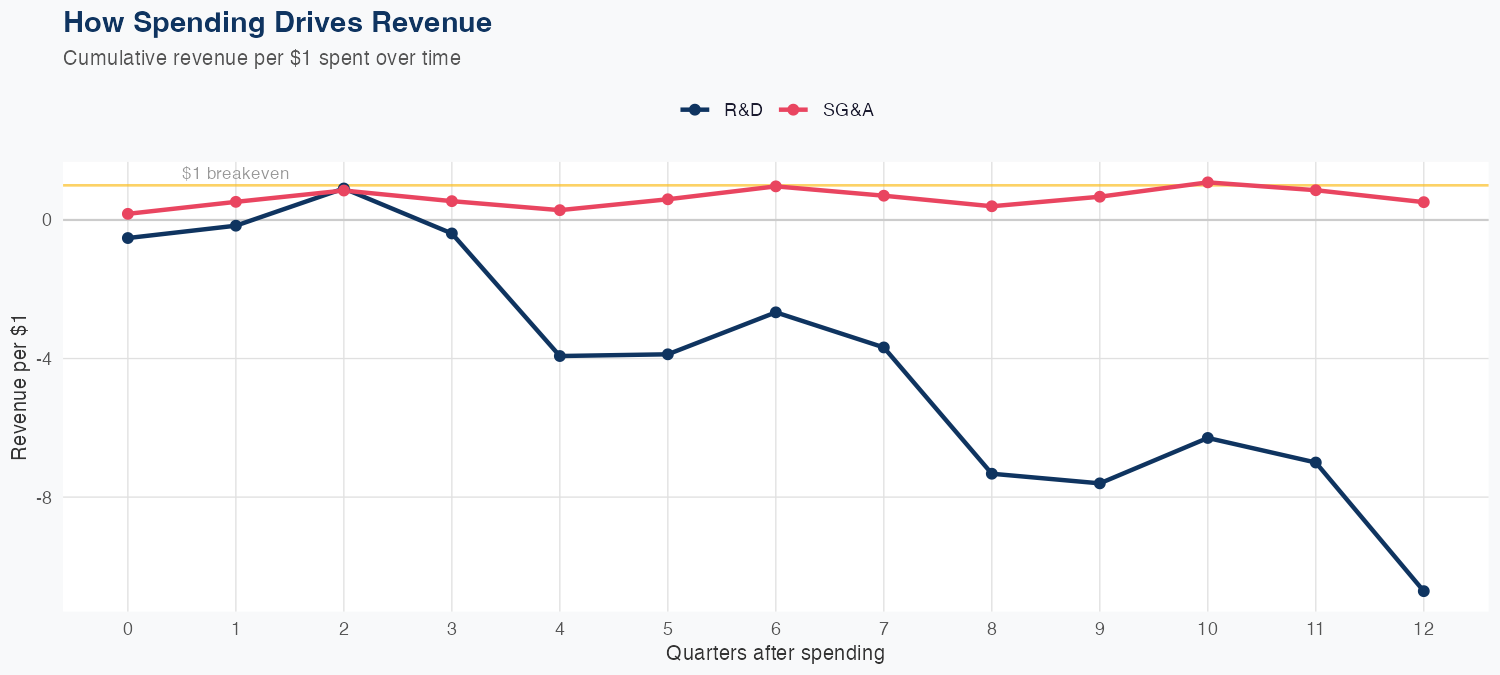
Revenue is driven modestly by R&D and more by SG&A investments, with elasticities of 0.05 and 0.21 per 1% spending, respectively, in a log-log model. That implies a very small ROI from R&D (0.05% revenue lift per 1% R&D spend) and a somewhat larger but still modest lift from SG&A (0.21% per 1% SG&A), highlighting SG&A efficiency as the more potent driver of topline growth. The model’s holdout accuracy shows a -4.5% miss (predicted 454M vs actual 435M) and an overall MAPE of 3.7%, indicating reasonable predictive performance. The FY revenue forecast is $2,084M, up 23.0% year over year, suggesting solid top-line momentum with growth primarily emerging from SG&A-driven lift and a modest contribution from R&D.
Investment Thesis
The econometric model achieves strong accuracy (3.7% MAPE), suggesting Paycom Software, Inc.'s revenue trajectory is well-characterized by its spending patterns. R&D investment shows a 0.05x multiplier — each 1% increase in R&D spend is associated with a 0.05% revenue increase, signaling strong innovation-to-revenue conversion. Sales & marketing spend shows a 0.21x elasticity, suggesting effective go-to-market execution.
Revenue Forecast
Quarterly Detail
| Quarter | Model Forecast | Actual | 95% Range | YoY Growth | Status |
|---|---|---|---|---|---|
| Q4 2023 | $454B | $435B | $411B – $502B | +22.5% | ✓ In range |
| Q2 2024 | $536B | $466B – $618B | +18.7% | ||
| Q3 2024 | $499B | $419B – $593B | +24.3% | ||
| Q4 2024 | $498B | $407B – $608B | +22.5% | ||
| Q1 2025 | $552B | $441B – $690B | +26.9% |
Seasonal Factors
| Fiscal Quarter | Seasonal Factor | vs Trend | Interpretation | Obs. |
|---|---|---|---|---|
| FQ1 (Sep–Nov) | 1.0143 | +1.4% | In line with trend | 10 |
| FQ2 (Dec–Feb) | 1.0151 | +1.5% | In line with trend | 10 |
| FQ3 (Mar–May) | 1.0062 | +0.6% | In line with trend | 10 |
| FQ4 (Jun–Aug) | 1.0101 | +1.0% | In line with trend | 10 |
How Spending Drives Revenue
Want this analysis for your portfolio?
I build custom revenue intelligence reports for investors and companies using SEC filing data, econometric modeling, and AI-powered insights.
Get in Touch