Parker-Hannifin Corporation PH
Revenue Intelligence Report • 53 quarters of SEC filing data • Updated 2026-03-15
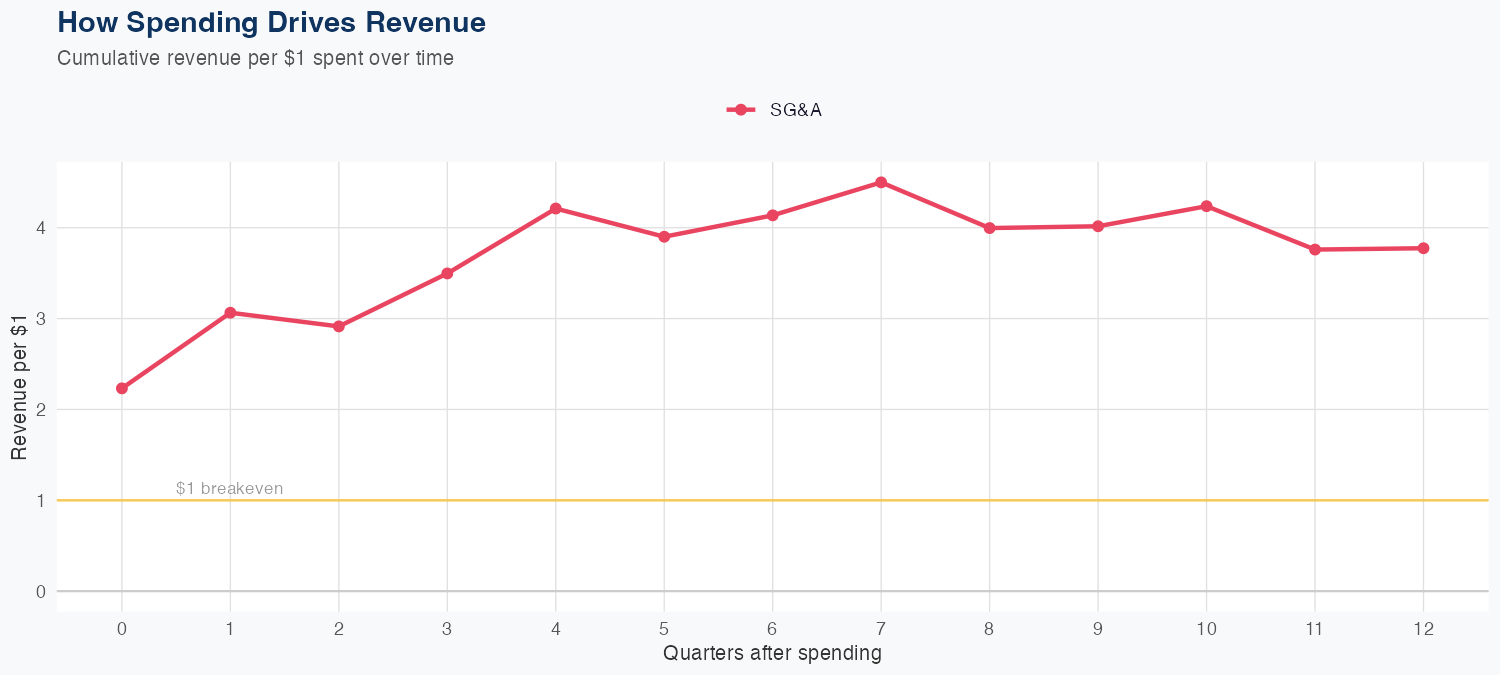
With 53 quarters of data under a linear model, SG&A spending is a primary revenue driver, as every $1 of SG&A is estimated to generate $3.77 in long-run revenue. The forecasting framework shows solid accuracy at 2.8% MAPE, with a holdout test error of 5.2% (predicted $4.9B vs actual $5.2B). The latest quarterly revenue was $5.174B, and the FY forecast calls for about $20B in revenue, down 2.1% YoY. The near-term outlook points to a modest topline decline, but the ROI from SG&A spending remains favorable, supporting long-run revenue growth through disciplined cost allocation.
Investment Thesis
Our ARDL model tracks Parker-Hannifin Corporation's revenue with exceptional precision (2.8% MAPE), indicating highly predictable cash flows. Each $1 of SG&A spending generates $3.77 in revenue, reflecting strong commercial efficiency.
Revenue Forecast
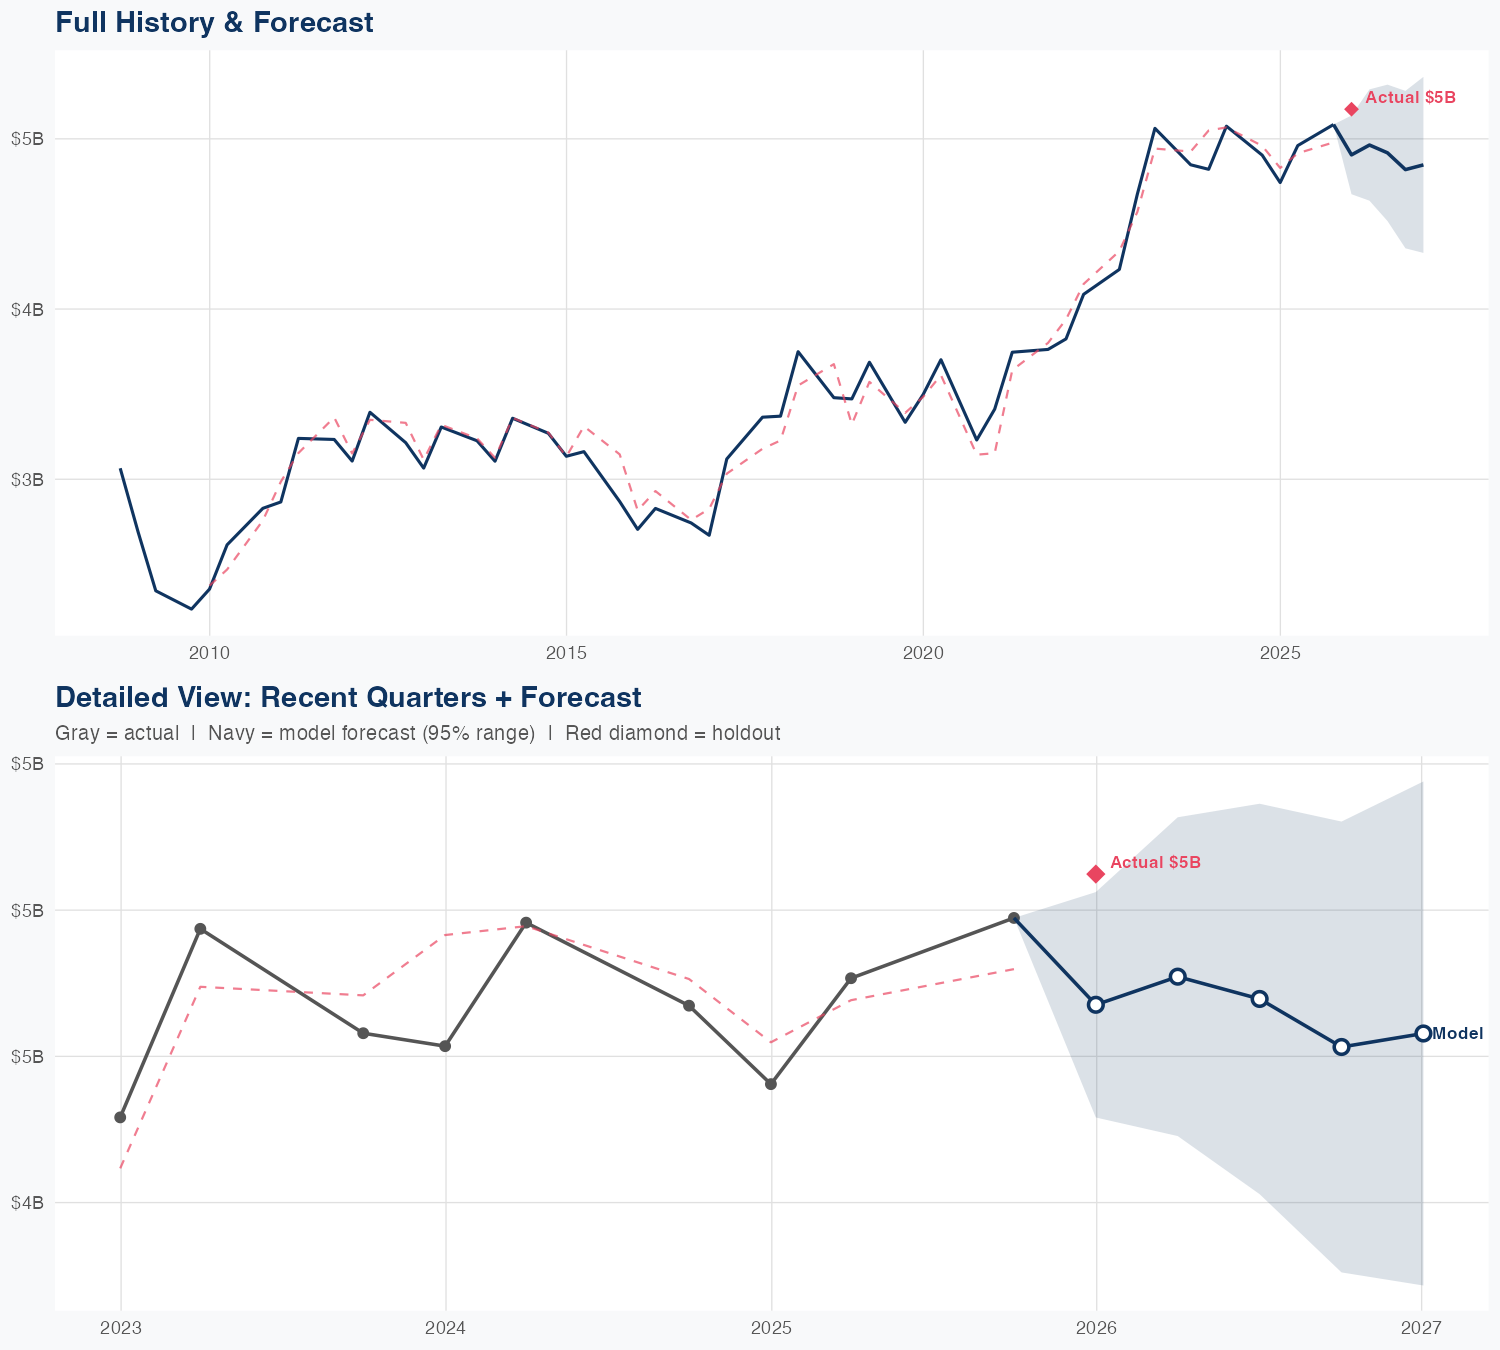
Quarterly Detail
| Quarter | Model Forecast | Actual | 95% Range | YoY Growth | Status |
|---|---|---|---|---|---|
| Q4 2025 | $4.9B | $5.2B | $4.7B – $5.1B | +0.0% | ✗ Outside range |
| Q2 2026 | $5.0B | $4.6B – $5.3B | +4.6% | ||
| Q3 2026 | $4.9B | $4.5B – $5.3B | -0.9% | ||
| Q4 2026 | $4.8B | $4.4B – $5.3B | -5.2% | ||
| Q1 2027 | $4.8B | $4.3B – $5.4B | -6.3% |
Seasonal Factors
| Fiscal Quarter | Seasonal Factor | vs Trend | Interpretation | Obs. |
|---|---|---|---|---|
| FQ1 (Sep–Nov) | 0.99 | -1.0% | In line with trend | 16 |
| FQ2 (Dec–Feb) | 0.9914 | -0.9% | In line with trend | 17 |
| FQ3 (Mar–May) | 1.0241 | +2.4% | In line with trend | 16 |
| FQ4 (Jun–Aug) | 1.0 | +0.0% | In line with trend | 0 |
How Spending Drives Revenue
Want this analysis for your portfolio?
I build custom revenue intelligence reports for investors and companies using SEC filing data, econometric modeling, and AI-powered insights.
Get in Touch