Royal Caribbean Cruises Ltd. RCL
Revenue Intelligence Report • 68 quarters of SEC filing data • Updated 2026-03-15
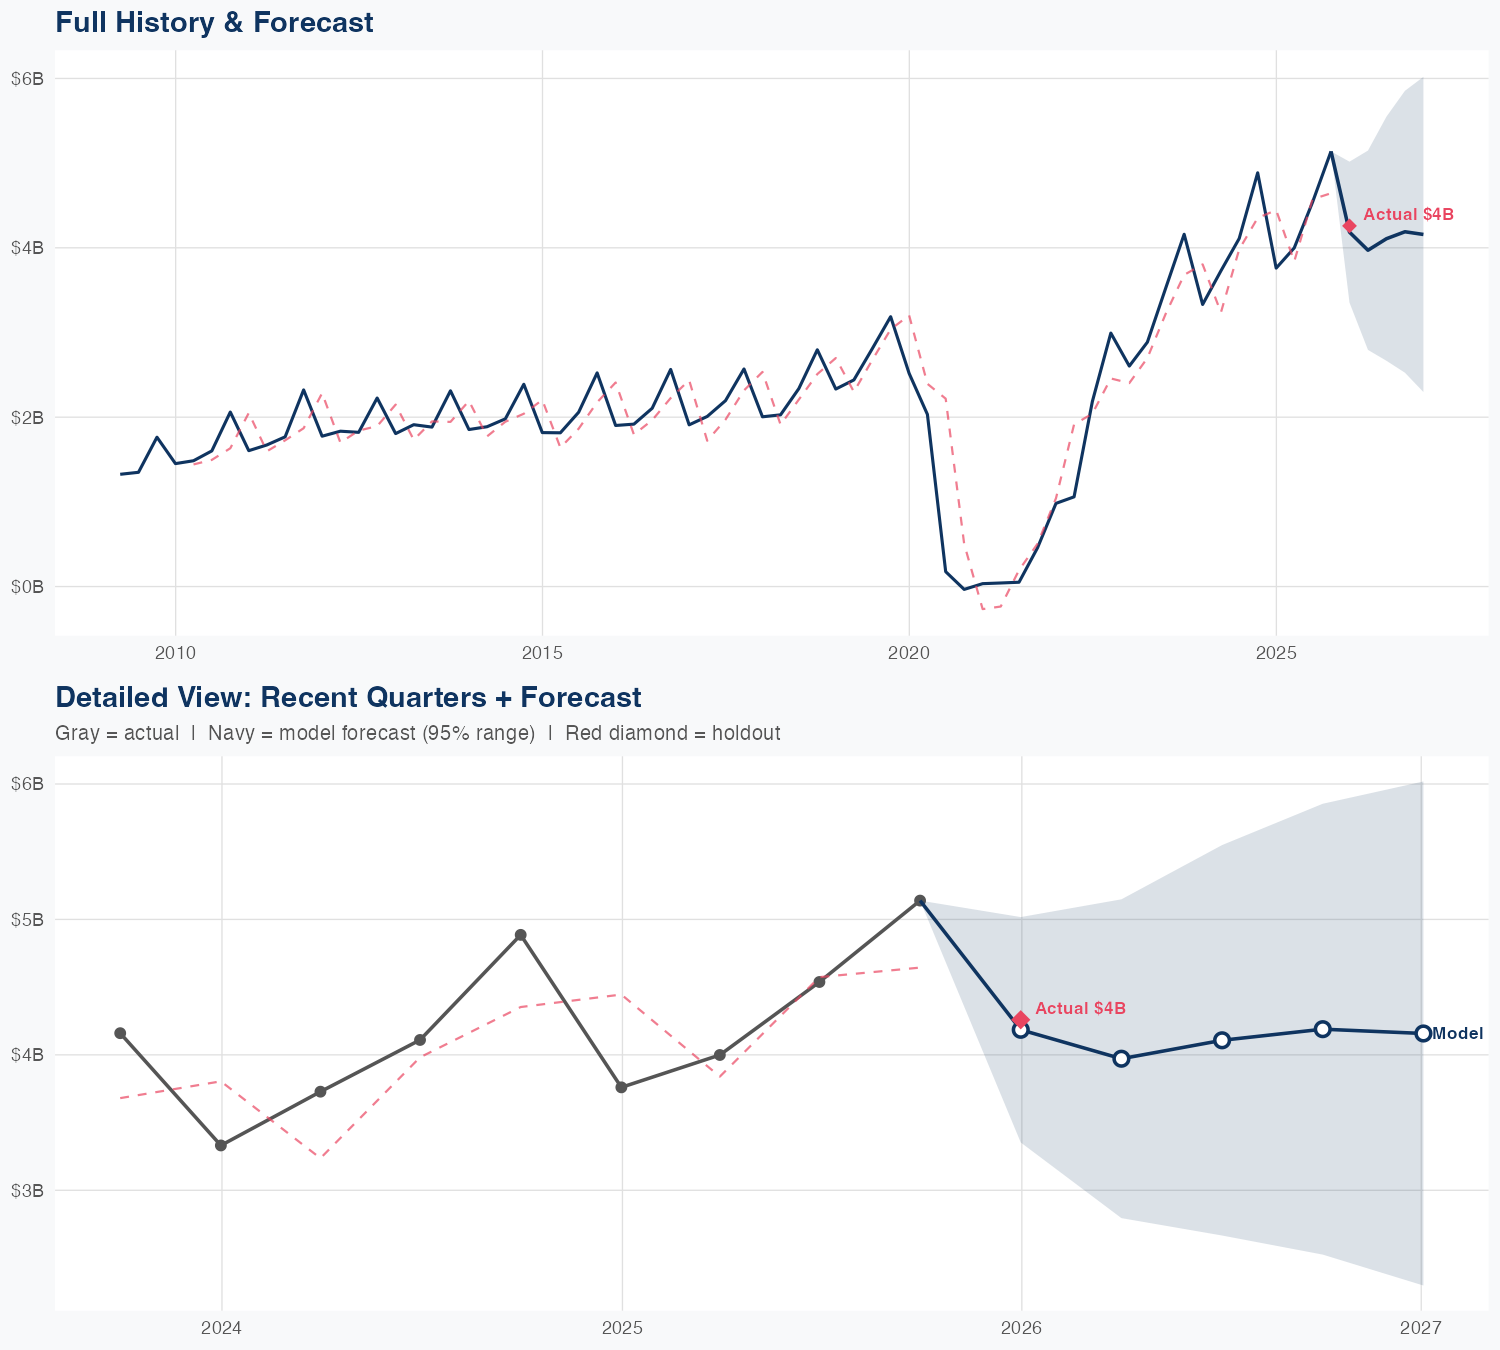
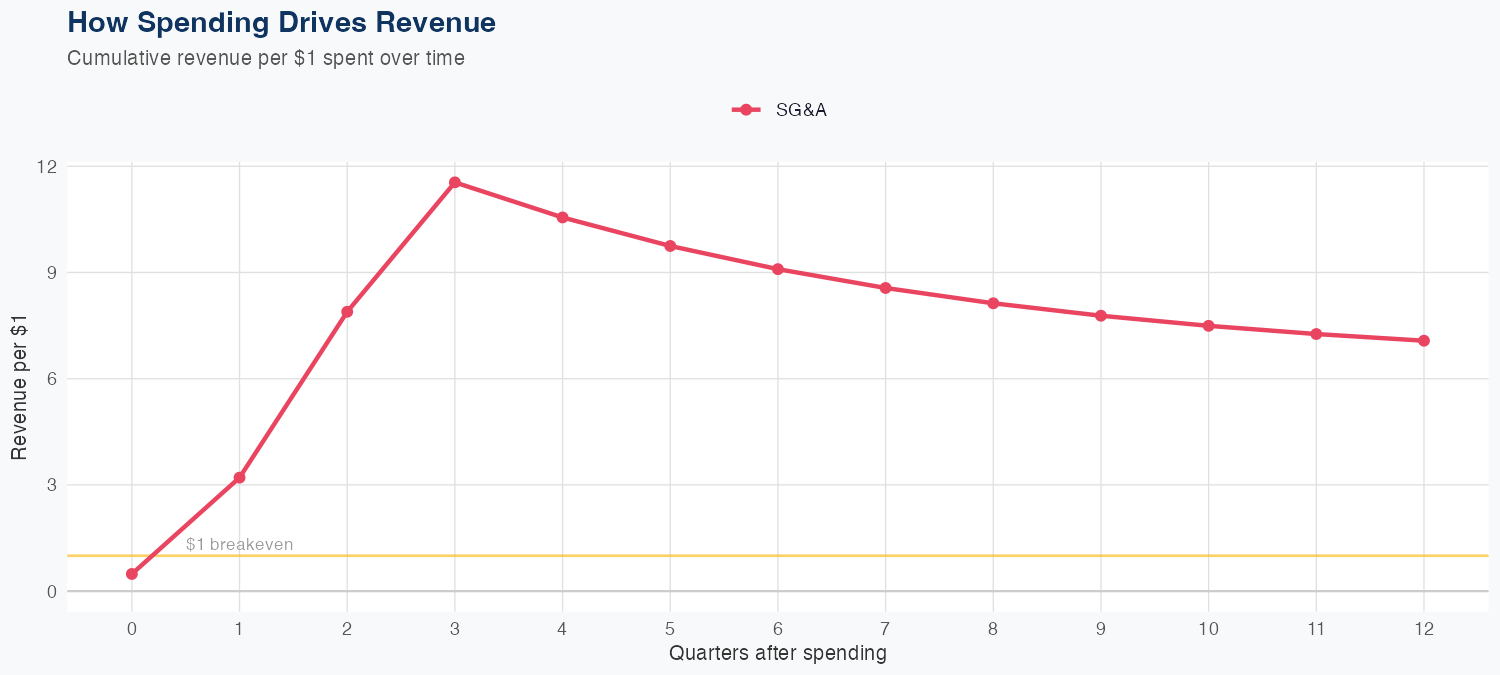
The latest quarterly revenue was $4.259 billion, underpinned by a data-rich history of 68 quarters that supports a linear revenue model. The model implies strong ROI on SG&A spending, with every $1 of SG&A generating about $7.07 in long-run revenue. Forecasting performance is credible in holdout testing (predicted $4.2B vs actual $4.3B, 1.7% error) and overall accuracy is 83.2% MAPE. The FY revenue forecast is $16B, down 8.4% year over year, suggesting a modest near-term decline despite efficient SG&A-driven revenue generation; investors should monitor demand recovery and how SG&A investments translate into top-line gains.
Investment Thesis
At 83.2% MAPE, the model captures Royal Caribbean Cruises Ltd.'s broad revenue trajectory, though quarterly variability suggests sensitivity to external factors. Each $1 of SG&A spending generates $7.07 in revenue, reflecting strong commercial efficiency.
Revenue Forecast
Quarterly Detail
| Quarter | Model Forecast | Actual | 95% Range | YoY Growth | Status |
|---|---|---|---|---|---|
| Q4 2025 | $4.2B | $4.3B | $3.4B – $5.0B | +11.3% | ✓ In range |
| Q2 2026 | $4.0B | $2.8B – $5.1B | -0.7% | ||
| Q3 2026 | $4.1B | $2.7B – $5.5B | -9.5% | ||
| Q4 2026 | $4.2B | $2.5B – $5.9B | -18.5% | ||
| Q1 2027 | $4.2B | $2.3B – $6.0B | -2.4% |
Seasonal Factors
| Fiscal Quarter | Seasonal Factor | vs Trend | Interpretation | Obs. |
|---|---|---|---|---|
| FQ1 (Sep–Nov) | 1.1518 | +15.2% | +15.2% above trend | 16 |
| FQ2 (Dec–Feb) | 0.8407 | -15.9% | -15.9% below trend | 15 |
| FQ3 (Mar–May) | 1.0645 | +6.5% | +6.5% above trend | 15 |
| FQ4 (Jun–Aug) | 1.0502 | +5.0% | +5.0% above trend | 16 |
How Spending Drives Revenue
Want this analysis for your portfolio?
I build custom revenue intelligence reports for investors and companies using SEC filing data, econometric modeling, and AI-powered insights.
Get in Touch