Ross Stores, Inc. ROST
Revenue Intelligence Report • 67 quarters of SEC filing data • Updated 2026-03-15
Based on 67 quarters of data, revenue appears driven primarily by SG&A efficiency, with the model attributing $6.32 of long-run revenue to each $1 of SG&A spend, signaling a high ROI on operating expenses. The modeling framework is linear, with a 5.5% MAPE and a holdout error of 11.7% (predicted 4.9B vs actual 5.6B), indicating moderate accuracy and some near-term uncertainty. Latest quarterly revenue stands at $5.6B, while the FY forecast is $22B, down 2.1% year over year. The outlook suggests that sustained SG&A efficiency can support revenue despite near-term softness, but investors should monitor pricing, traffic, and competitive dynamics in the discount retail sector given the model’s uncertainty.
Investment Thesis
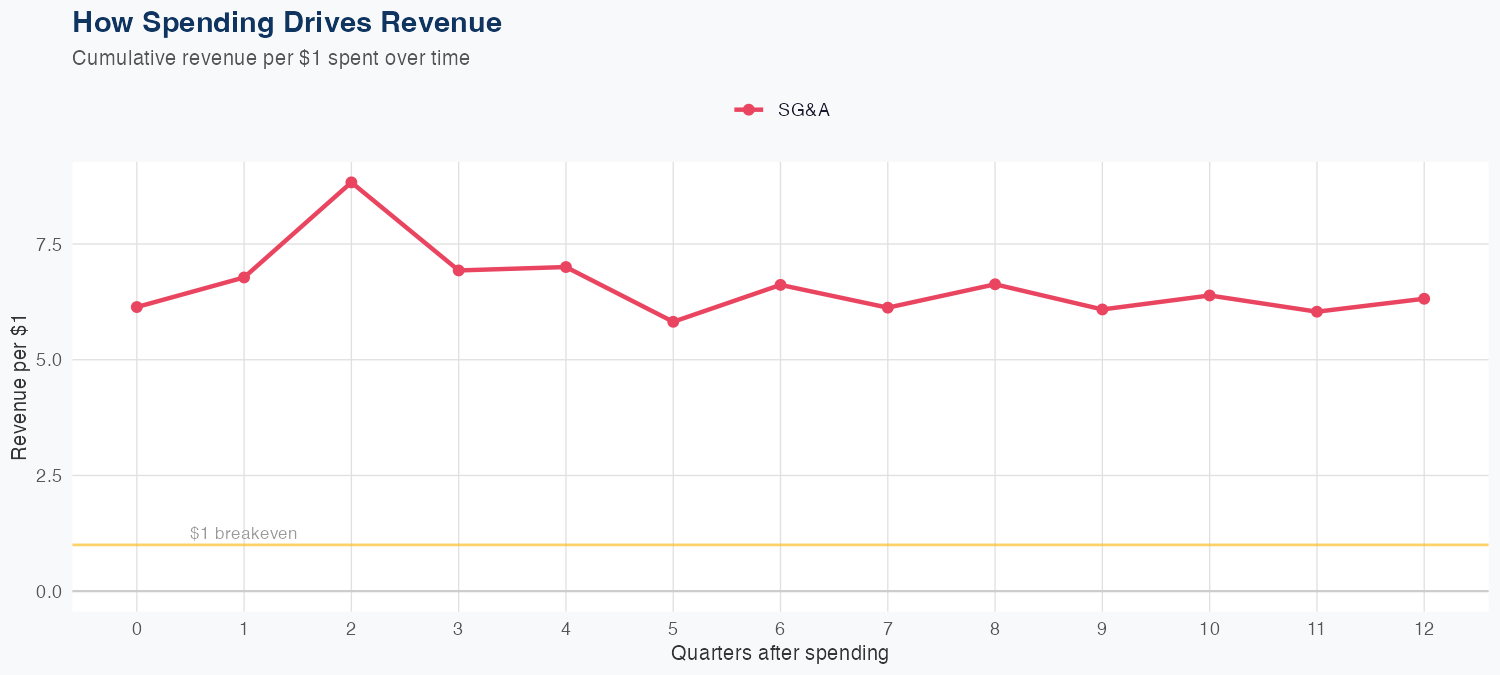
The econometric model achieves strong accuracy (5.5% MAPE), suggesting Ross Stores, Inc.'s revenue trajectory is well-characterized by its spending patterns. Each $1 of SG&A spending generates $6.32 in revenue, reflecting strong commercial efficiency.
Revenue Forecast
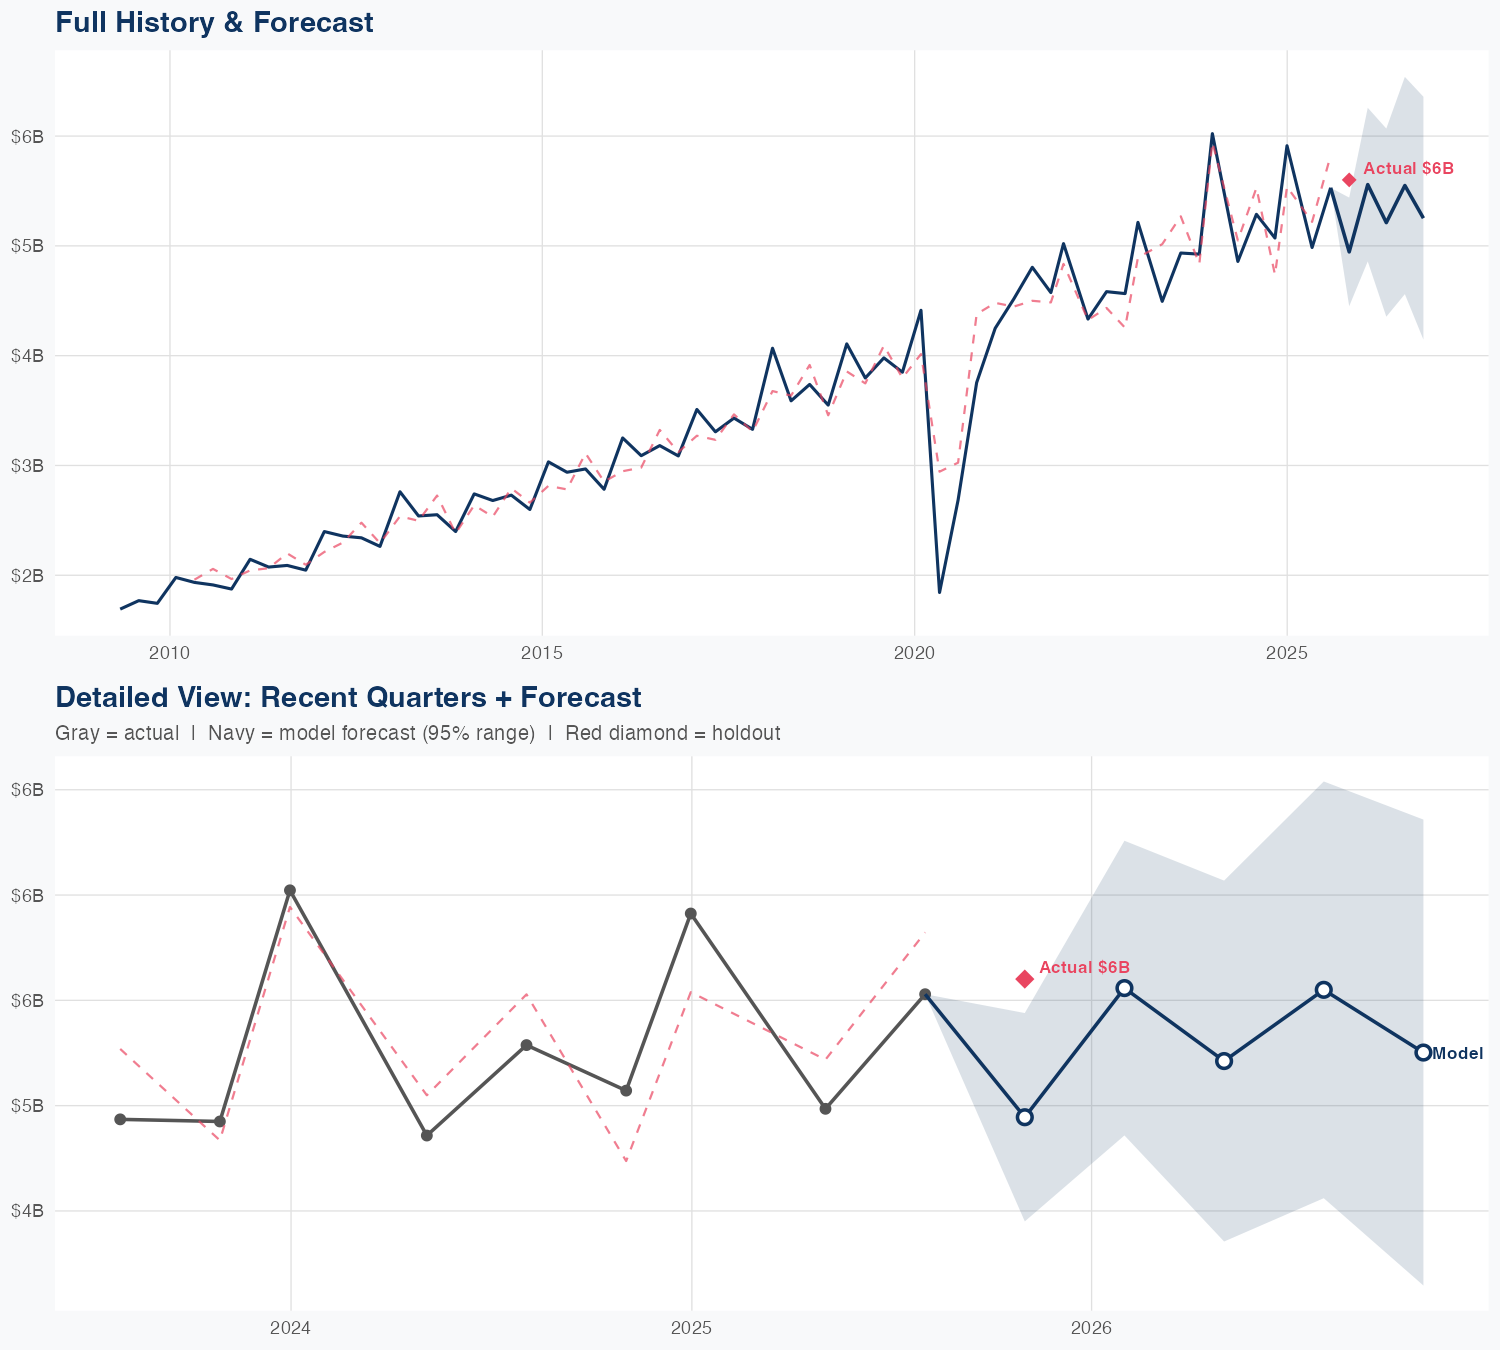
Quarterly Detail
| Quarter | Model Forecast | Actual | 95% Range | YoY Growth | Status |
|---|---|---|---|---|---|
| Q4 2025 | $4.9B | $5.6B | $4.5B – $5.4B | -2.5% | ✗ Outside range |
| Q1 2026 | $5.6B | $4.9B – $6.3B | -6.0% | ||
| Q2 2026 | $5.2B | $4.4B – $6.1B | +4.5% | ||
| Q3 2026 | $5.5B | $4.6B – $6.5B | +0.4% | ||
| Q4 2026 | $5.3B | $4.1B – $6.4B | -6.2% |
Seasonal Factors
| Fiscal Quarter | Seasonal Factor | vs Trend | Interpretation | Obs. |
|---|---|---|---|---|
| FQ1 (Sep–Nov) | 1.0067 | +0.7% | In line with trend | 16 |
| FQ2 (Dec–Feb) | 1.0674 | +6.7% | +6.7% above trend | 15 |
| FQ3 (Mar–May) | 1.0132 | +1.3% | In line with trend | 16 |
| FQ4 (Jun–Aug) | 0.9547 | -4.5% | -4.5% below trend | 16 |
How Spending Drives Revenue
Want this analysis for your portfolio?
I build custom revenue intelligence reports for investors and companies using SEC filing data, econometric modeling, and AI-powered insights.
Get in Touch