Republic Services, Inc. RSG
Revenue Intelligence Report • 70 quarters of SEC filing data • Updated 2026-03-15
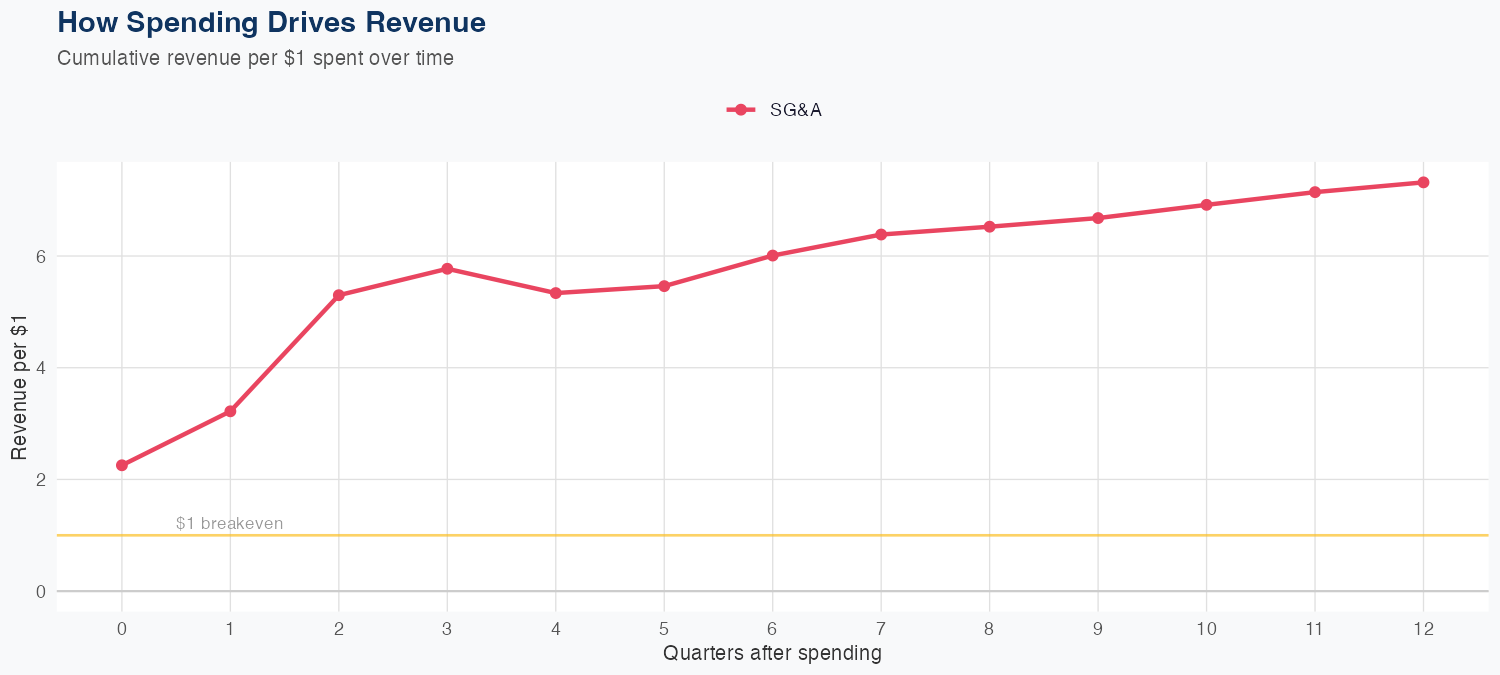
Revenue growth is being driven, in part, by SG&A investments, with a log-log elasticity of about 0.58, meaning a 1% rise in SG&A is associated with roughly 0.58% higher revenue. That SG&A-driven revenue lever implies a moderate ROI from selling and administration spend, though profitability depends on margins not provided. The model shows solid predictive performance, with a 2.9% MAPE and a holdout test of predicted $4.8B vs actual $4.7B (-0.8% error). The FY revenue forecast is $20B, up about 2.9% year over year, indicating a steady growth trajectory supported by the same revenue-driving dynamic.
Investment Thesis
Our ARDL model tracks Republic Services, Inc.'s revenue with exceptional precision (2.9% MAPE), indicating highly predictable cash flows. Sales & marketing spend shows a 0.58x elasticity, suggesting effective go-to-market execution.
Revenue Forecast
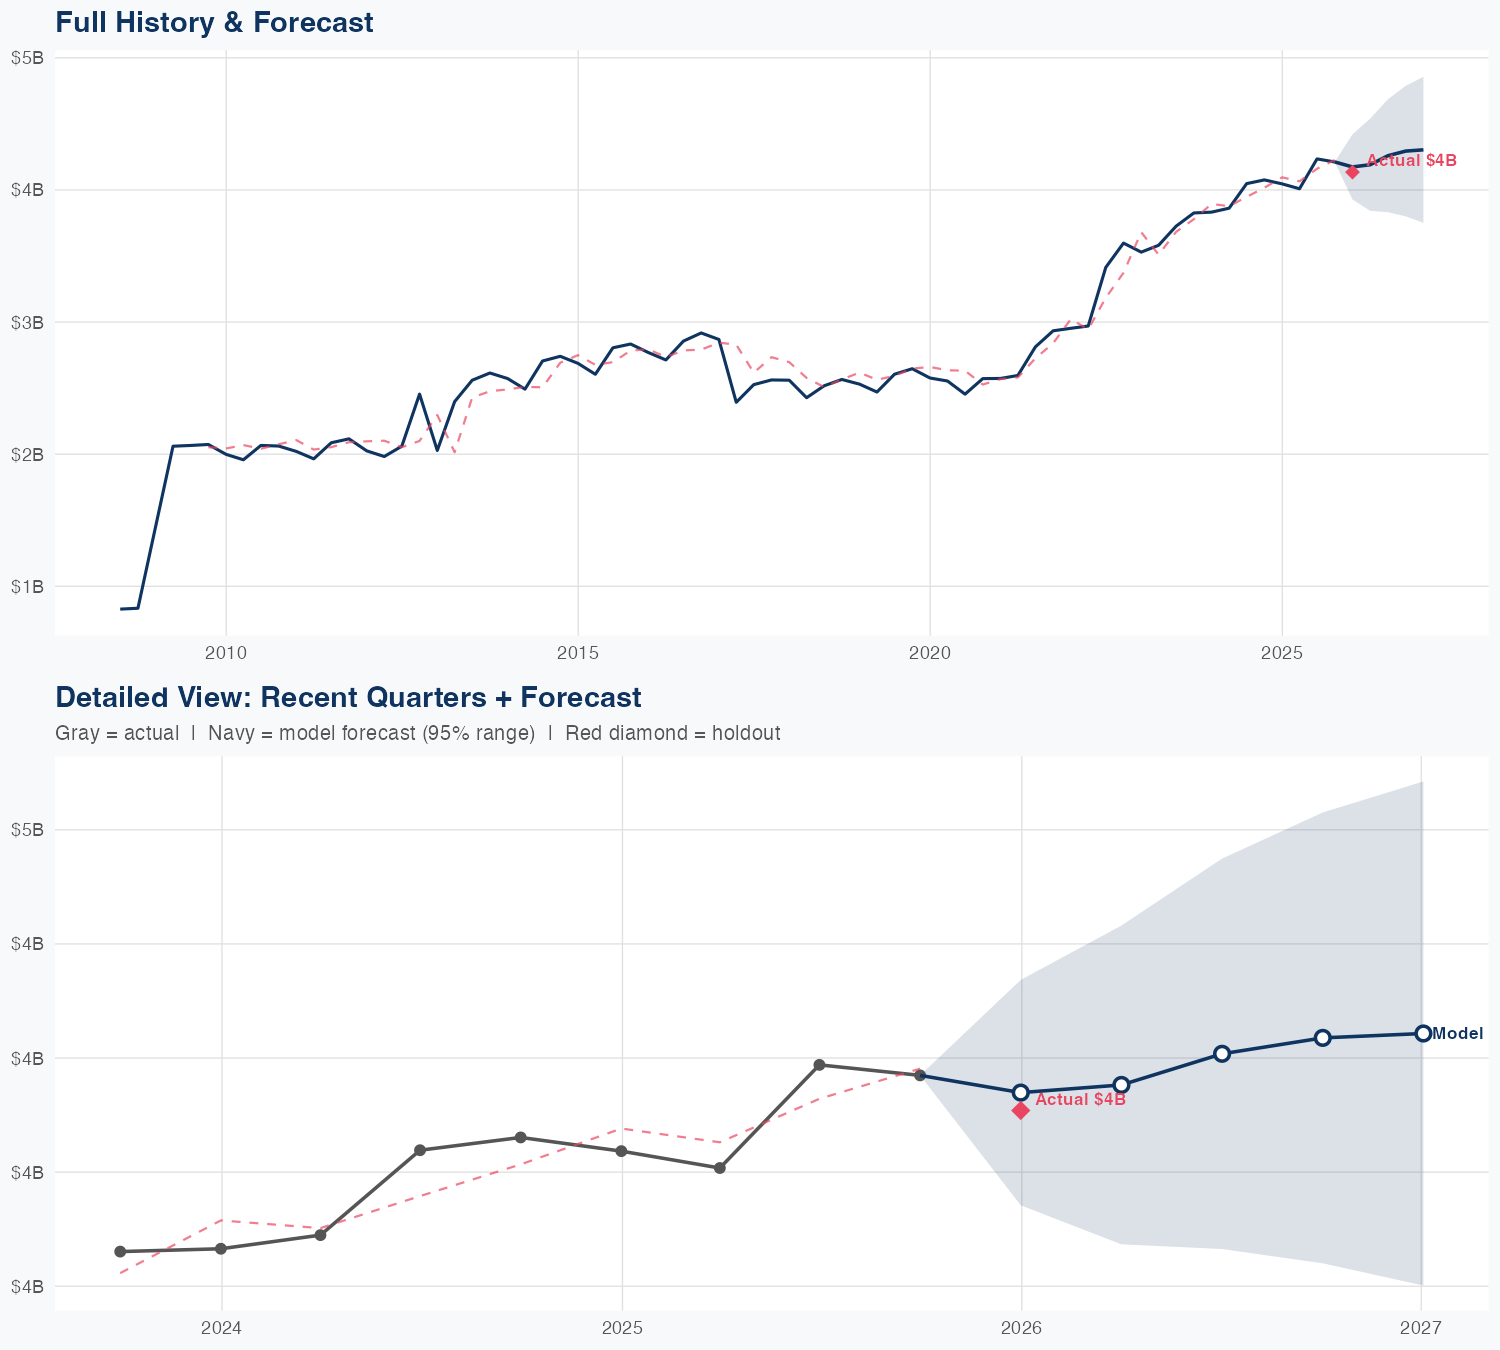
Quarterly Detail
| Quarter | Model Forecast | Actual | 95% Range | YoY Growth | Status |
|---|---|---|---|---|---|
| Q4 2025 | $4.8B | $4.7B | $4.4B – $5.2B | +2.7% | ✓ In range |
| Q2 2026 | $4.8B | $4.3B – $5.4B | +4.4% | ||
| Q3 2026 | $4.9B | $4.2B – $5.7B | +0.5% | ||
| Q4 2026 | $4.9B | $4.2B – $5.8B | +2.3% | ||
| Q1 2027 | $4.9B | $4.1B – $5.9B | +4.5% |
Seasonal Factors
| Fiscal Quarter | Seasonal Factor | vs Trend | Interpretation | Obs. |
|---|---|---|---|---|
| FQ1 (Sep–Nov) | 1.0125 | +1.2% | In line with trend | 17 |
| FQ2 (Dec–Feb) | 0.9778 | -2.2% | In line with trend | 17 |
| FQ3 (Mar–May) | 0.9772 | -2.3% | In line with trend | 16 |
| FQ4 (Jun–Aug) | 1.0128 | +1.3% | In line with trend | 16 |
How Spending Drives Revenue
Want this analysis for your portfolio?
I build custom revenue intelligence reports for investors and companies using SEC filing data, econometric modeling, and AI-powered insights.
Get in Touch