Synopsys Inc SNPS
Revenue Intelligence Report • 50 quarters of SEC filing data • Updated 2026-03-15
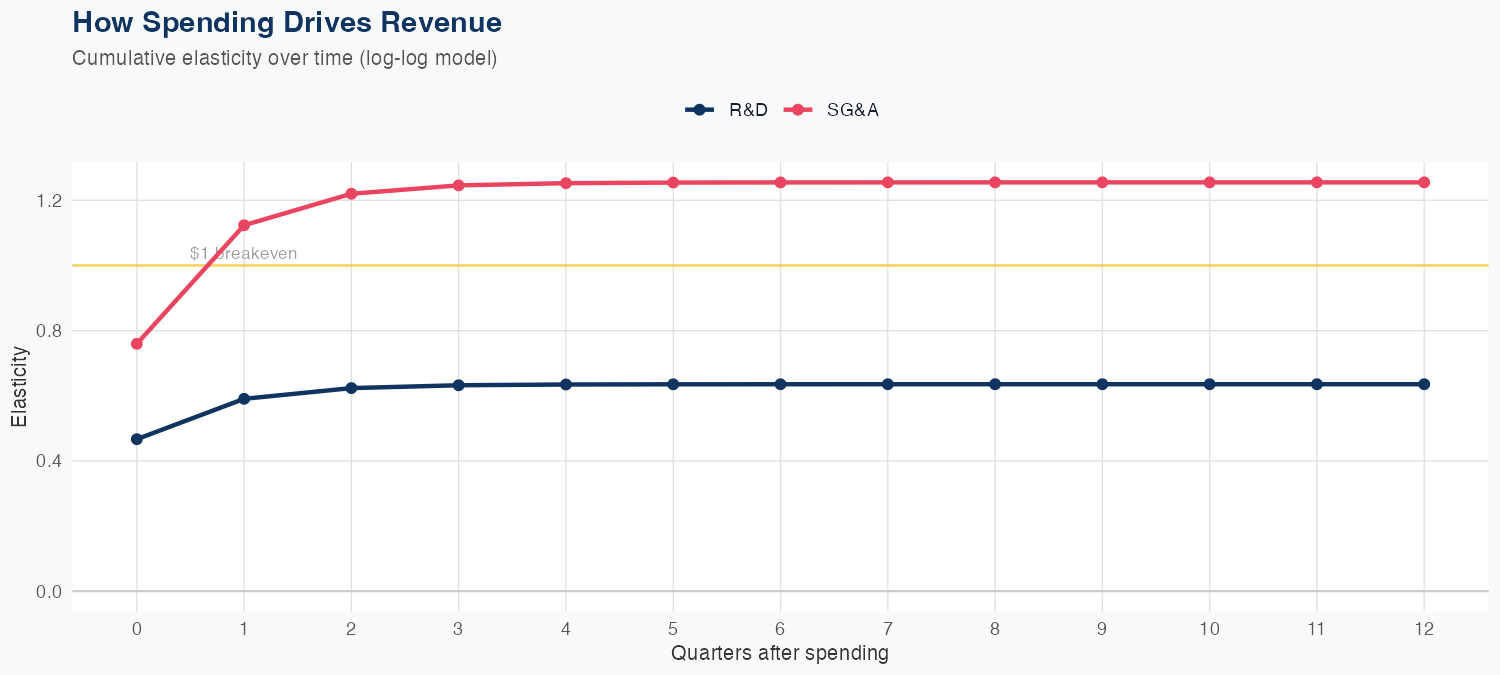
Revenue is more sensitive to SG&A spending than to R&D in the current log-log model, with a 1% increase in SG&A associated with a 1.26% rise in revenue and a 1% increase in R&D linked to a 0.64% rise; the latest quarterly revenue was $2.41 billion. This implies SG&A investments may yield higher top-line ROI per dollar spent, though the effect on margins remains unquantified. Model performance shows an overall accuracy of 3.2% MAPE, but a holdout test produced a 17.9% error (predicted $2.0B vs actual $2.4B), signaling potential volatility or regime changes that limit out-of-sample reliability. With a forecast of $9.0B for the year, up 25.5% year-over-year, the growth outlook is solid, but investors should monitor the efficiency of SG&A-driven growth as profitability translates into returns.
Investment Thesis
The econometric model achieves strong accuracy (3.2% MAPE), suggesting Synopsys Inc's revenue trajectory is well-characterized by its spending patterns. R&D investment shows a 0.64x multiplier — each 1% increase in R&D spend is associated with a 0.64% revenue increase, signaling strong innovation-to-revenue conversion. Sales & marketing spend shows a 1.26x elasticity, suggesting effective go-to-market execution.
Revenue Forecast
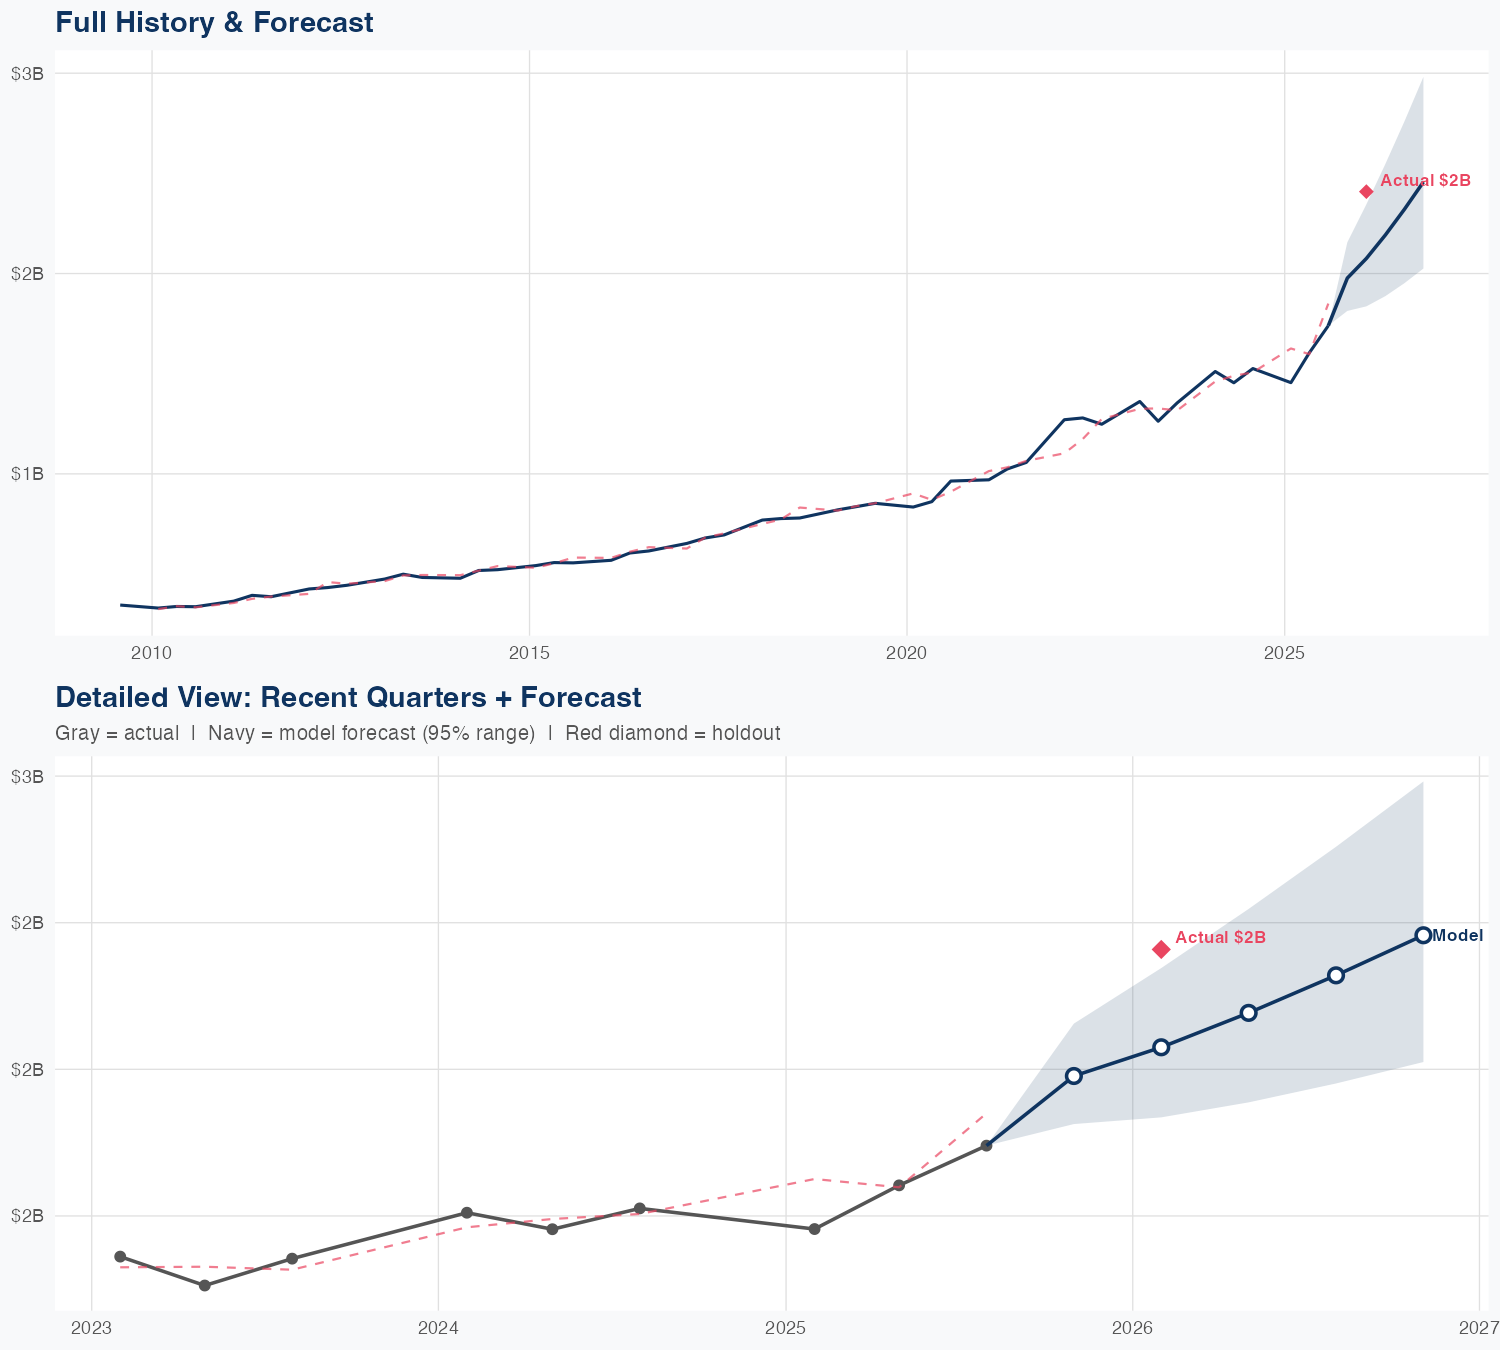
Quarterly Detail
| Quarter | Model Forecast | Actual | 95% Range | YoY Growth | Status |
|---|---|---|---|---|---|
| Q4 2025 | $2.0B | $2.4B | $1.8B – $2.2B | +29.6% | ✗ Outside range |
| Q1 2026 | $2.1B | $1.8B – $2.3B | +42.6% | ||
| Q2 2026 | $2.2B | $1.9B – $2.5B | +36.7% | ||
| Q3 2026 | $2.3B | $2.0B – $2.8B | +33.4% | ||
| Q4 2026 | $2.5B | $2.0B – $3.0B | +2.0% |
Seasonal Factors
| Fiscal Quarter | Seasonal Factor | vs Trend | Interpretation | Obs. |
|---|---|---|---|---|
| FQ1 (Sep–Nov) | 1.0 | +0.0% | In line with trend | 0 |
| FQ2 (Dec–Feb) | 1.0221 | +2.2% | In line with trend | 17 |
| FQ3 (Mar–May) | 0.9969 | -0.3% | In line with trend | 16 |
| FQ4 (Jun–Aug) | 0.9893 | -1.1% | In line with trend | 16 |
How Spending Drives Revenue
Want this analysis for your portfolio?
I build custom revenue intelligence reports for investors and companies using SEC filing data, econometric modeling, and AI-powered insights.
Get in Touch