Teledyne Technologies Inc TDY
Revenue Intelligence Report • 8 quarters of SEC filing data • Updated 2026-03-15
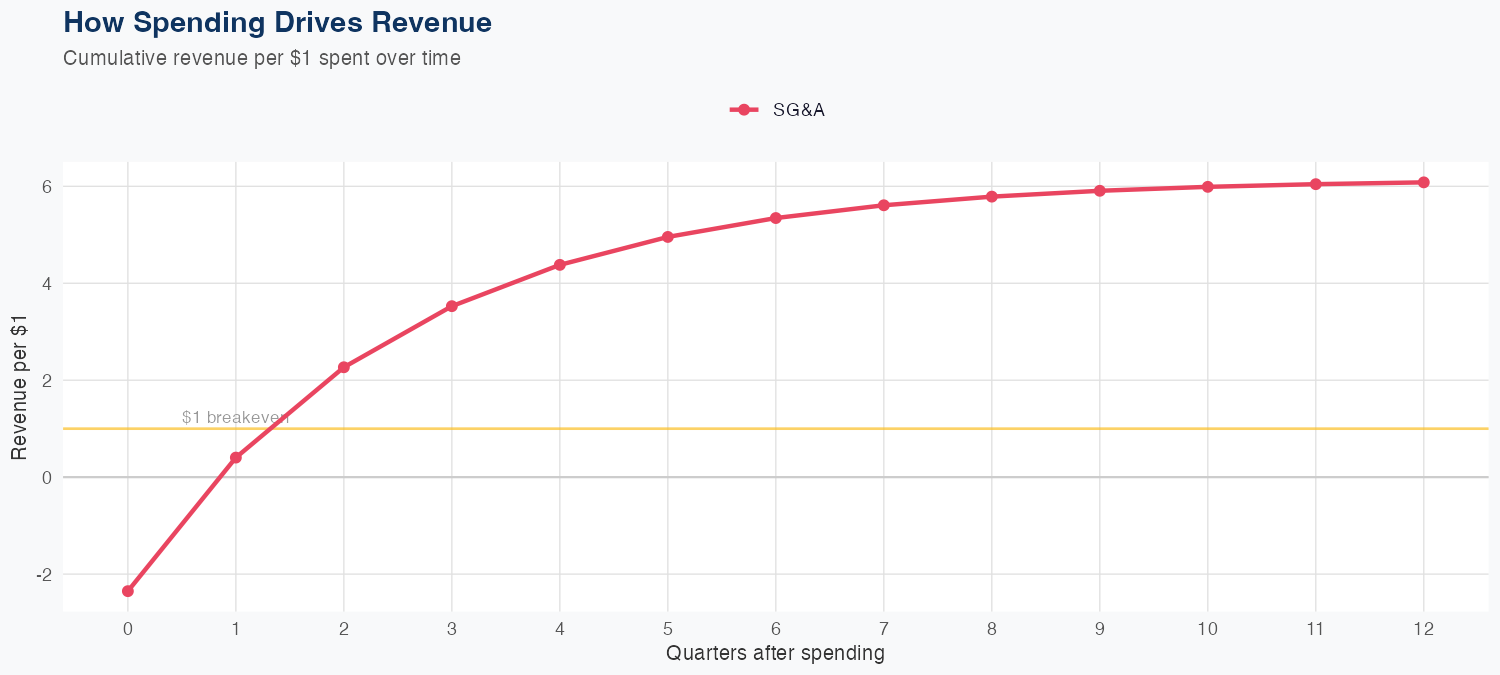
Revenue is driven by efficient SG&A leverage, with each dollar of SG&A generating about $6.08 in long-run revenue, signaling strong operating leverage from selling and general activities. Our linear model trained on eight quarterly observations achieves a 1.9% MAPE and a holdout test error of 2.8%, with predicted revenue of $1.6B aligning with the actual $1.6B. The latest quarterly revenue came in at $1.612B, and the FY forecast calls for roughly $6.4B in revenue, up about 5.4% year over year. The outlook suggests mid-single-digit growth supported by SG&A efficiency, though the absence of R&D data leaves product development impact unquantified; investors should monitor margins as SG&A-driven revenue growth evolves.
Investment Thesis
Our ARDL model tracks Teledyne Technologies Inc's revenue with exceptional precision (1.9% MAPE), indicating highly predictable cash flows. Each $1 of SG&A spending generates $6.08 in revenue, reflecting strong commercial efficiency.
Revenue Forecast
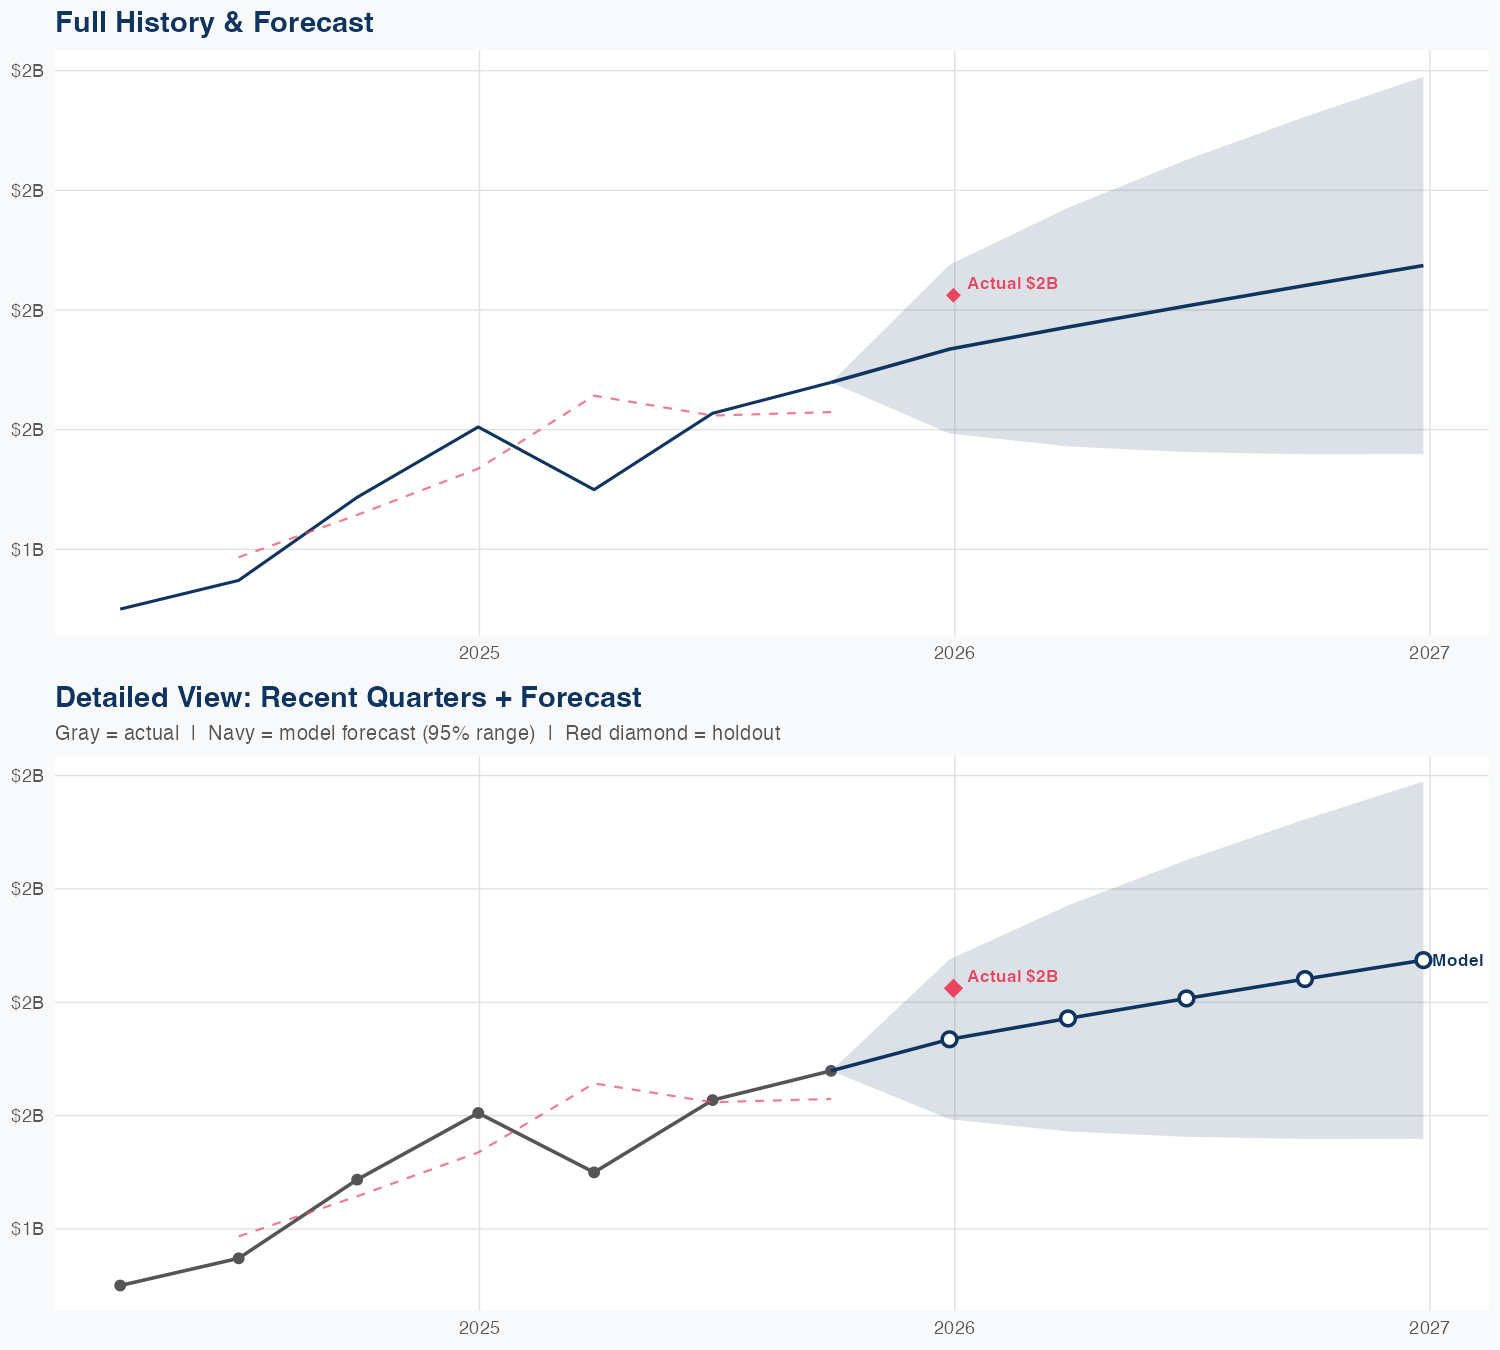
Quarterly Detail
| Quarter | Model Forecast | Actual | 95% Range | YoY Growth | Status |
|---|---|---|---|---|---|
| Q4 2025 | $1.6B | $1.6B | $1.5B – $1.6B | +4.3% | ✓ In range |
| Q1 2026 | $1.6B | $1.5B – $1.7B | +9.4% | ||
| Q2 2026 | $1.6B | $1.5B – $1.7B | +5.9% | ||
| Q3 2026 | $1.6B | $1.5B – $1.8B | +5.3% | ||
| Q4 2026 | $1.6B | $1.5B – $1.8B | +1.5% |
How Spending Drives Revenue
Want this analysis for your portfolio?
I build custom revenue intelligence reports for investors and companies using SEC filing data, econometric modeling, and AI-powered insights.
Get in Touch