Tesla, Inc. TSLA
Revenue Intelligence Report • 62 quarters of SEC filing data • Updated 2026-03-15
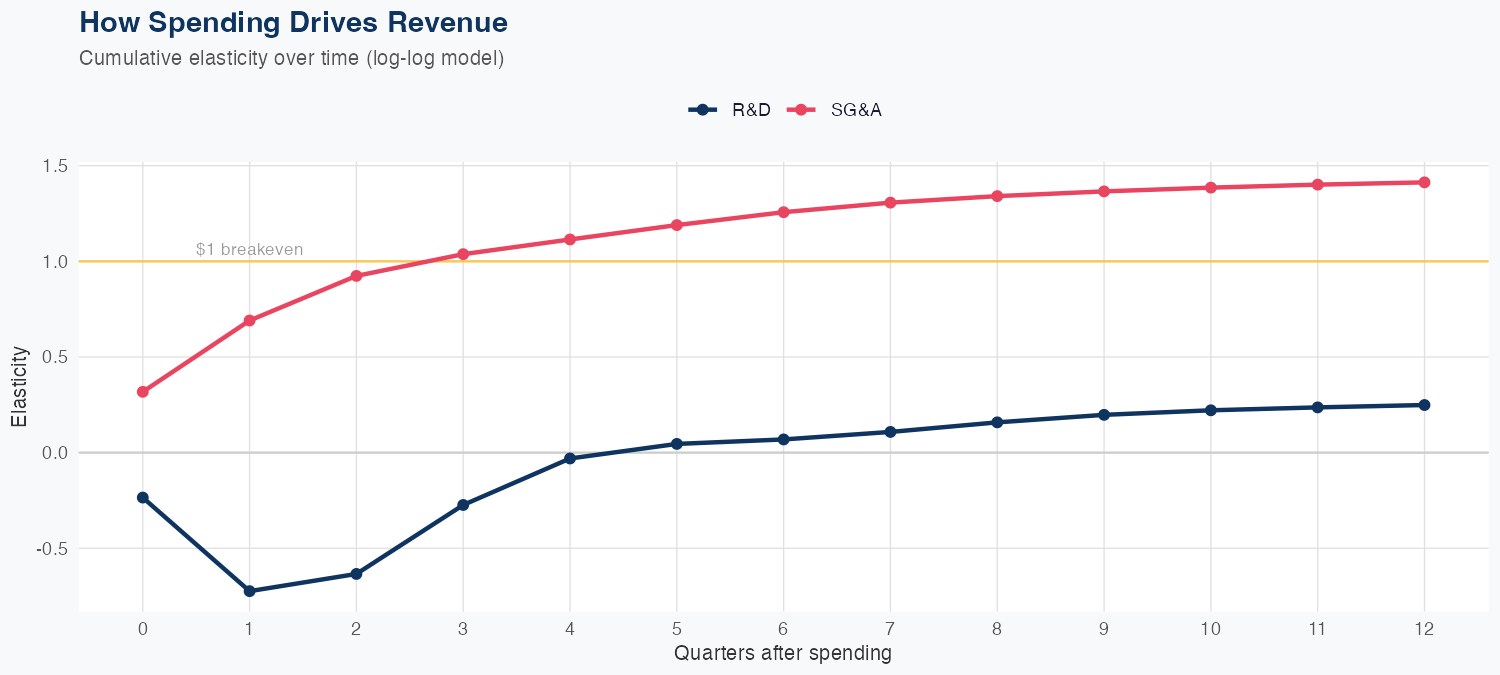
Tesla posted FY revenue of $114B, up 20% YoY. Our econometric model shows growth is not being driven by R&D intensity—R&D elasticity is 0.25x while SG&A elasticity is 1.41x—so SG&A spend grows far faster than revenue while R&D lags. In other words, growth looks more about scale, price/mix, and network/service expansion than a surge in new product innovation, implying limited near-term upside from R&D. The holdout for SG&A came in far below forecast (predicted $30.8B vs actual $24.9B), a 23.7% miss, signaling forecast risk and volatility in marketing, admin, and service costs as volume expands. With MAPE at 18.5%, forecast reliability is modest, and growth could pressure margins if SG&A outpaces gross profitability, especially amid price competition and regulatory costs.
Investment Thesis
At 18.5% MAPE, the model captures Tesla, Inc.'s broad revenue trajectory, though quarterly variability suggests sensitivity to external factors. R&D investment shows a 0.25x multiplier — each 1% increase in R&D spend is associated with a 0.25% revenue increase, signaling strong innovation-to-revenue conversion. Sales & marketing spend shows a 1.41x elasticity, suggesting effective go-to-market execution.
Revenue Forecast
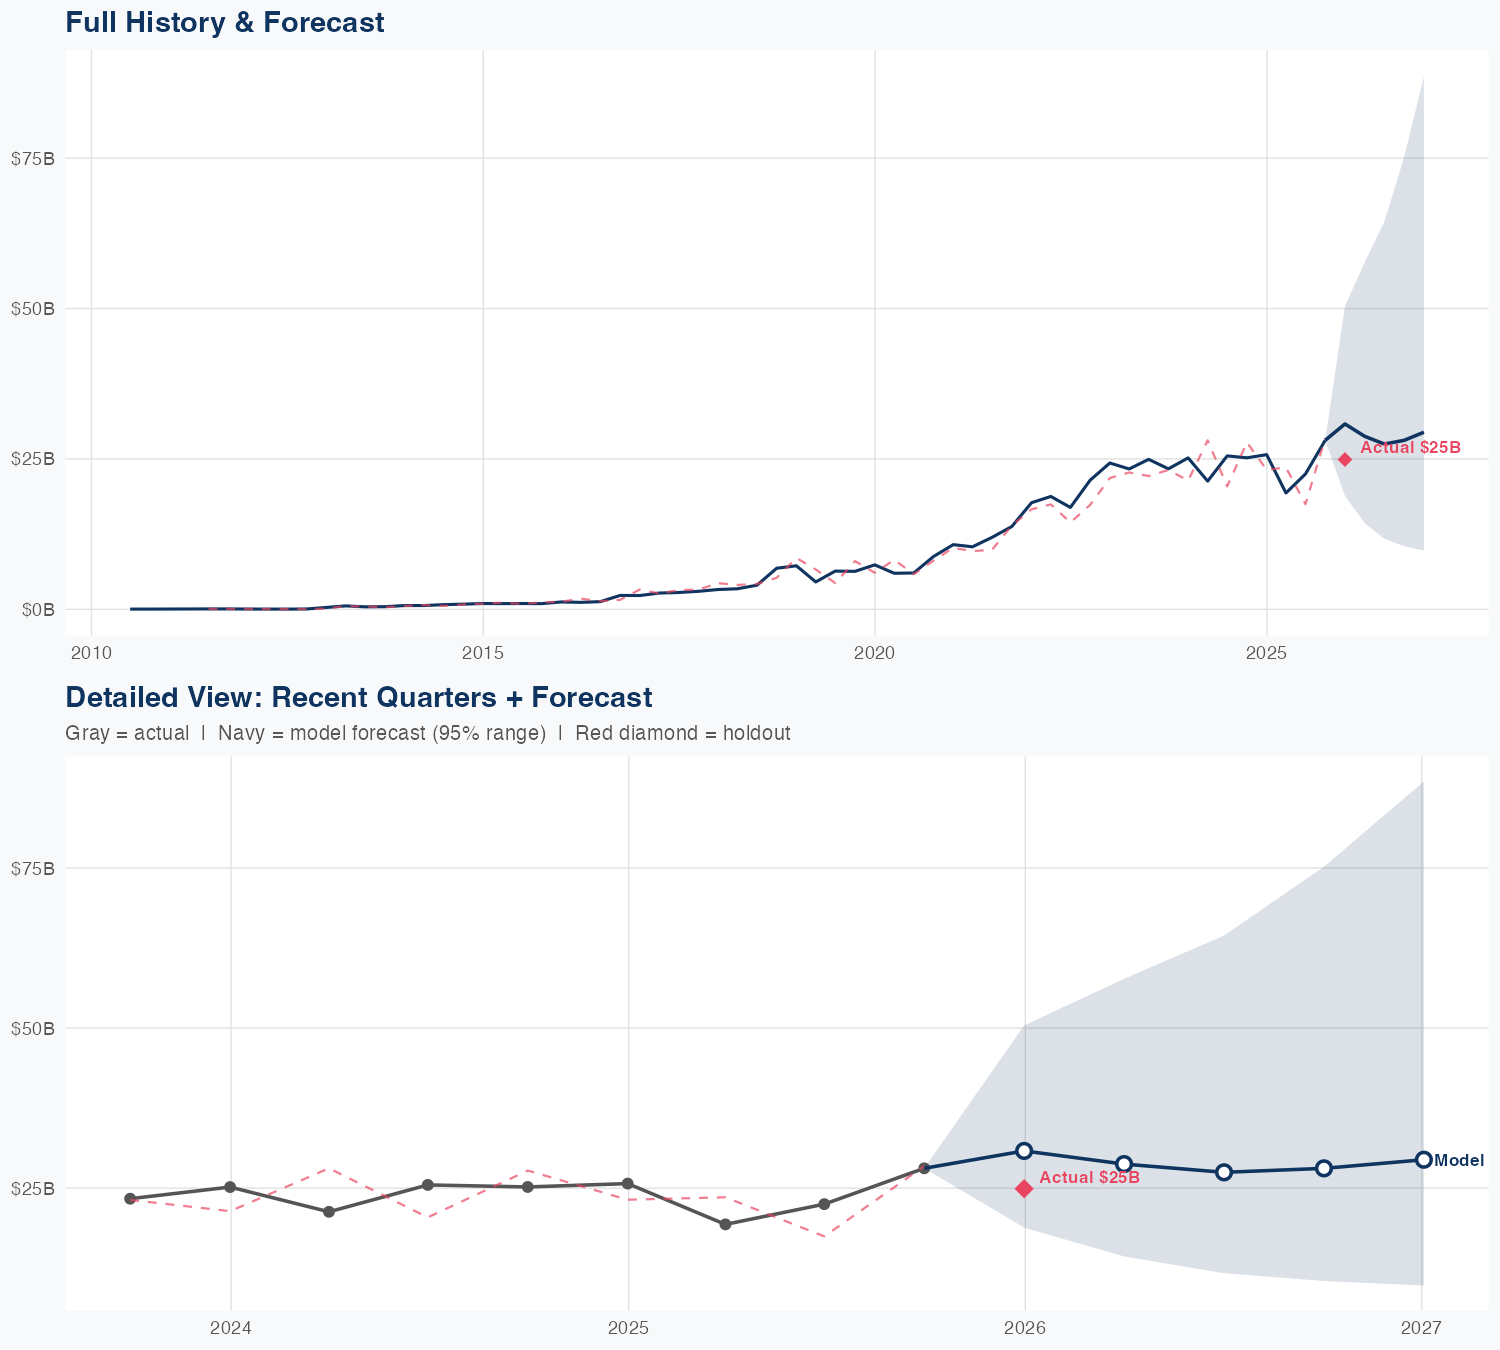
Quarterly Detail
| Quarter | Model Forecast | Actual | 95% Range | YoY Growth | Status |
|---|---|---|---|---|---|
| Q4 2025 | $31B | $25B | $19B – $50B | +19.9% | ✓ In range |
| Q2 2026 | $29B | $14B – $58B | +48.7% | ||
| Q3 2026 | $27B | $12B – $64B | +22.1% | ||
| Q4 2026 | $28B | $10B – $75B | -0.0% | ||
| Q1 2027 | $29B | $9.8B – $89B | +18.2% |
Seasonal Factors
| Fiscal Quarter | Seasonal Factor | vs Trend | Interpretation | Obs. |
|---|---|---|---|---|
| FQ1 (Sep–Nov) | 1.0175 | +1.7% | In line with trend | 15 |
| FQ2 (Dec–Feb) | 1.0517 | +5.2% | +5.2% above trend | 15 |
| FQ3 (Mar–May) | 0.8488 | -15.1% | -15.1% below trend | 14 |
| FQ4 (Jun–Aug) | 1.1209 | +12.1% | +12.1% above trend | 15 |
How Spending Drives Revenue
Want this analysis for your portfolio?
I build custom revenue intelligence reports for investors and companies using SEC filing data, econometric modeling, and AI-powered insights.
Get in Touch