Textron Inc. TXT
Revenue Intelligence Report • 8 quarters of SEC filing data • Updated 2026-03-15
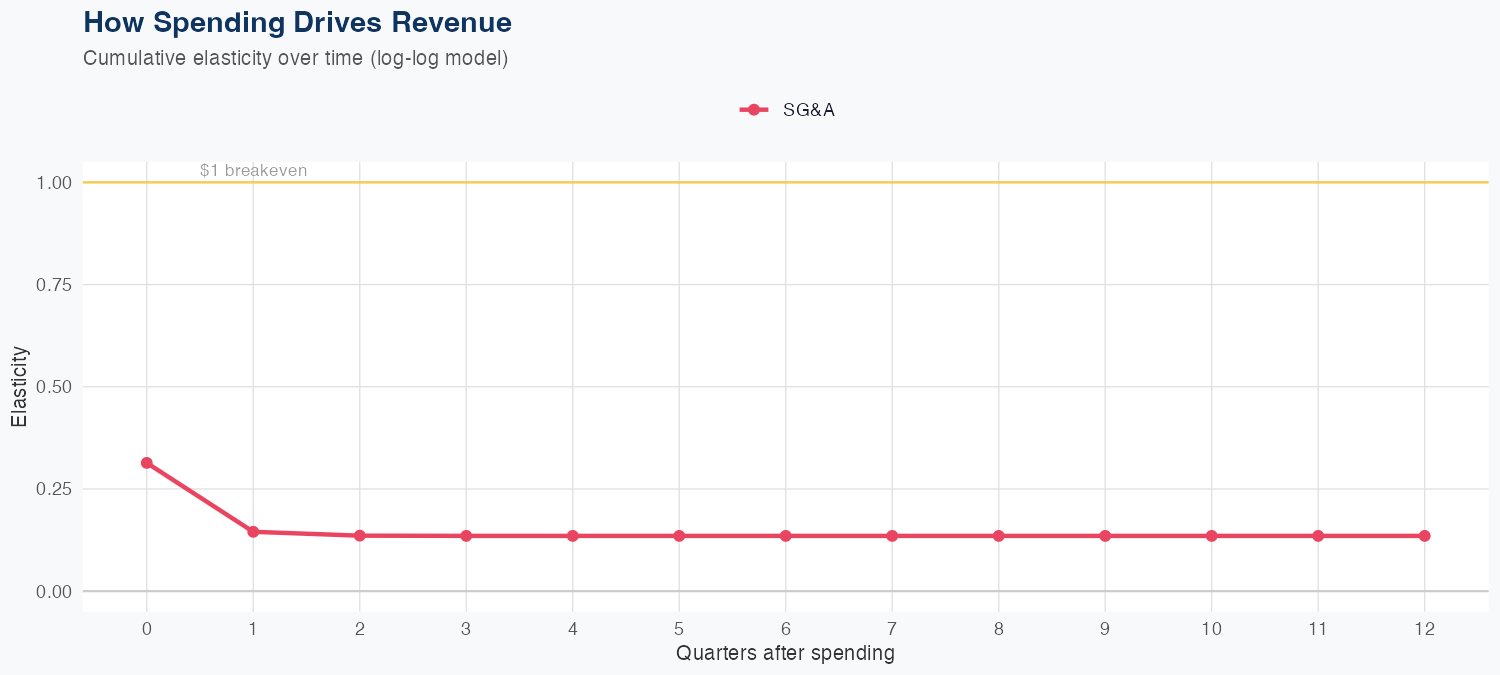
In a log-log framework, revenue is driven modestly by SG&A spending, with a 1% increase in SG&A yielding about a 0.14% rise in revenue, implying limited ROI from SG&A expansion. The latest quarterly revenue was $4.175 billion, and a holdout test predicted $3.6 billion versus an actual $4.2 billion (13.4% error), with overall model accuracy at 4.9% MAPE. For the full year, the forecast calls for roughly $14 billion in revenue, down 3.9% year over year, indicating modest near-term headwinds despite current-quarter strength.
Investment Thesis
The econometric model achieves strong accuracy (4.9% MAPE), suggesting Textron Inc.'s revenue trajectory is well-characterized by its spending patterns. Sales & marketing spend shows a 0.14x elasticity, suggesting effective go-to-market execution.
Revenue Forecast
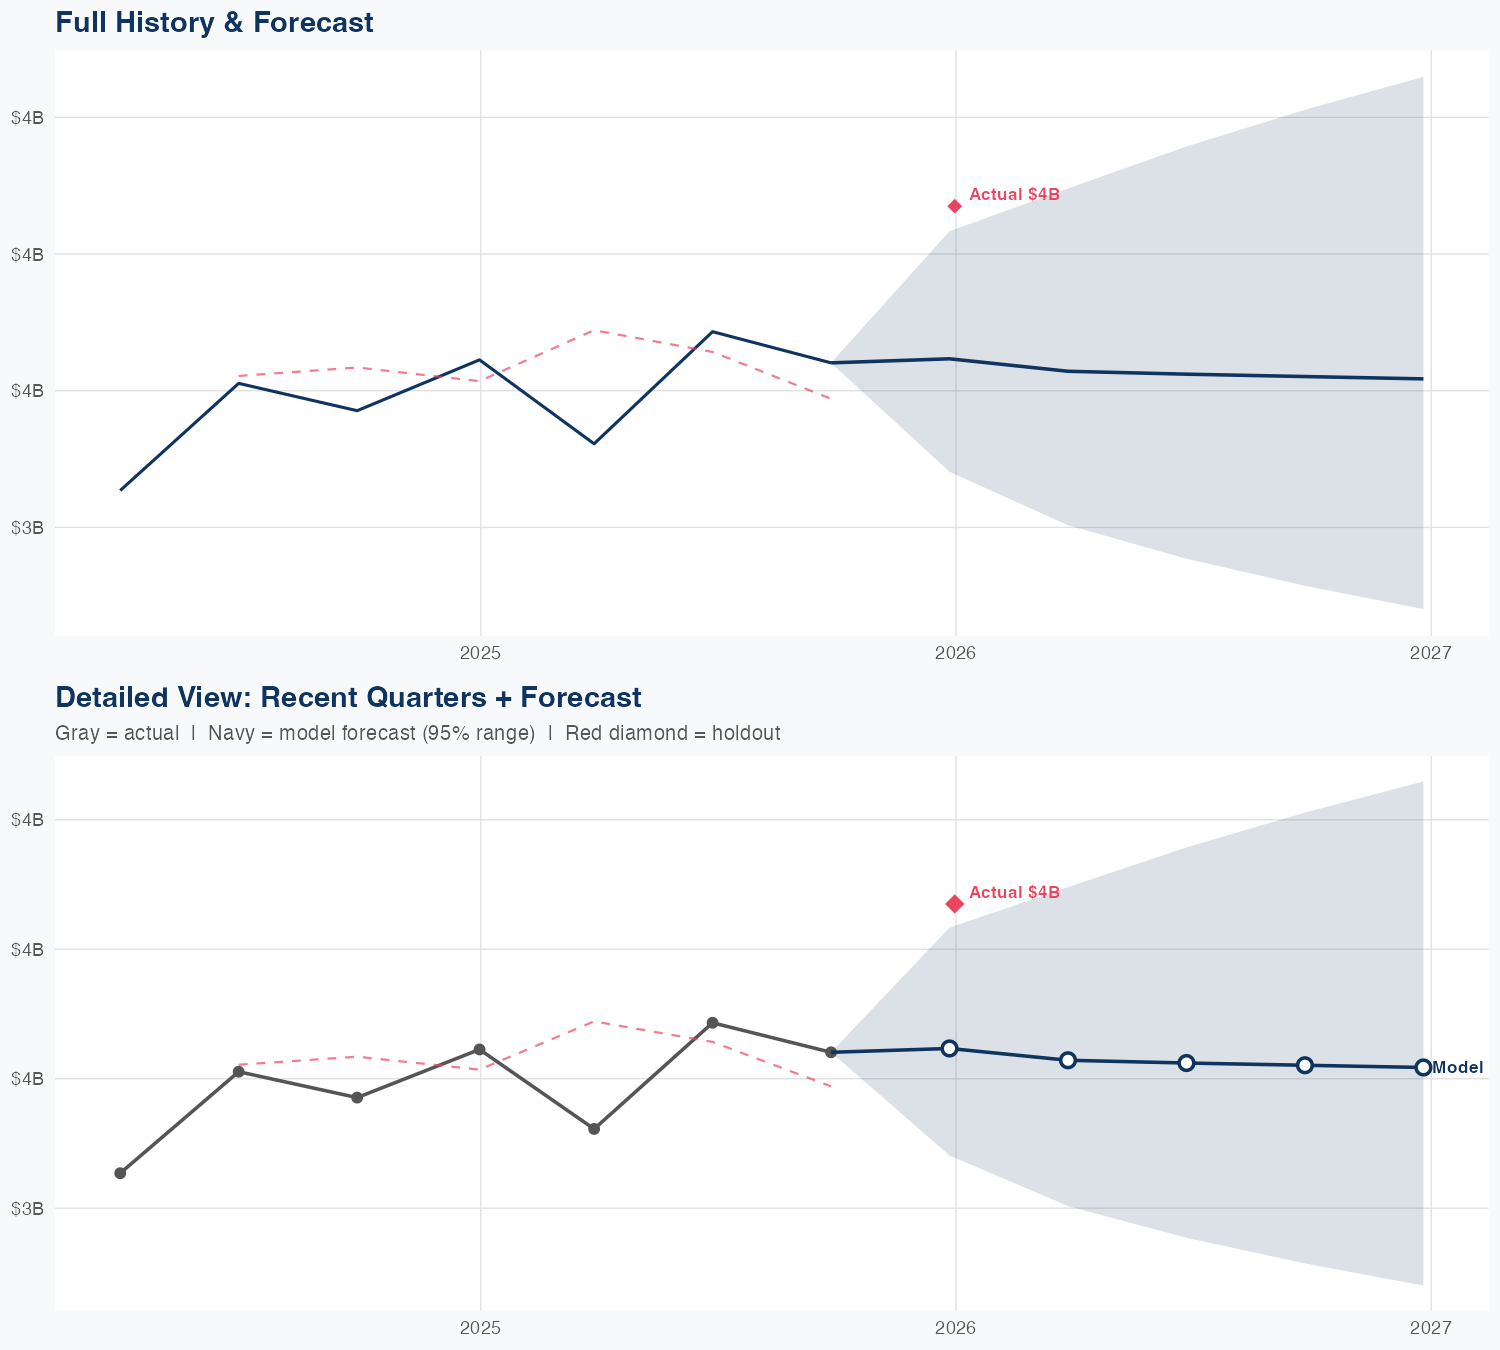
Quarterly Detail
| Quarter | Model Forecast | Actual | 95% Range | YoY Growth | Status |
|---|---|---|---|---|---|
| Q4 2025 | $3.6B | $4.2B | $3.2B – $4.1B | +0.1% | ✗ Outside range |
| Q1 2026 | $3.6B | $3.0B – $4.2B | +8.0% | ||
| Q2 2026 | $3.6B | $2.9B – $4.4B | -4.2% | ||
| Q3 2026 | $3.6B | $2.8B – $4.5B | -1.4% | ||
| Q4 2026 | $3.5B | $2.7B – $4.6B | -15.1% |
How Spending Drives Revenue
Want this analysis for your portfolio?
I build custom revenue intelligence reports for investors and companies using SEC filing data, econometric modeling, and AI-powered insights.
Get in Touch