Unitedhealth Group Incorporated UNH
Revenue Intelligence Report • 70 quarters of SEC filing data • Updated 2026-03-15
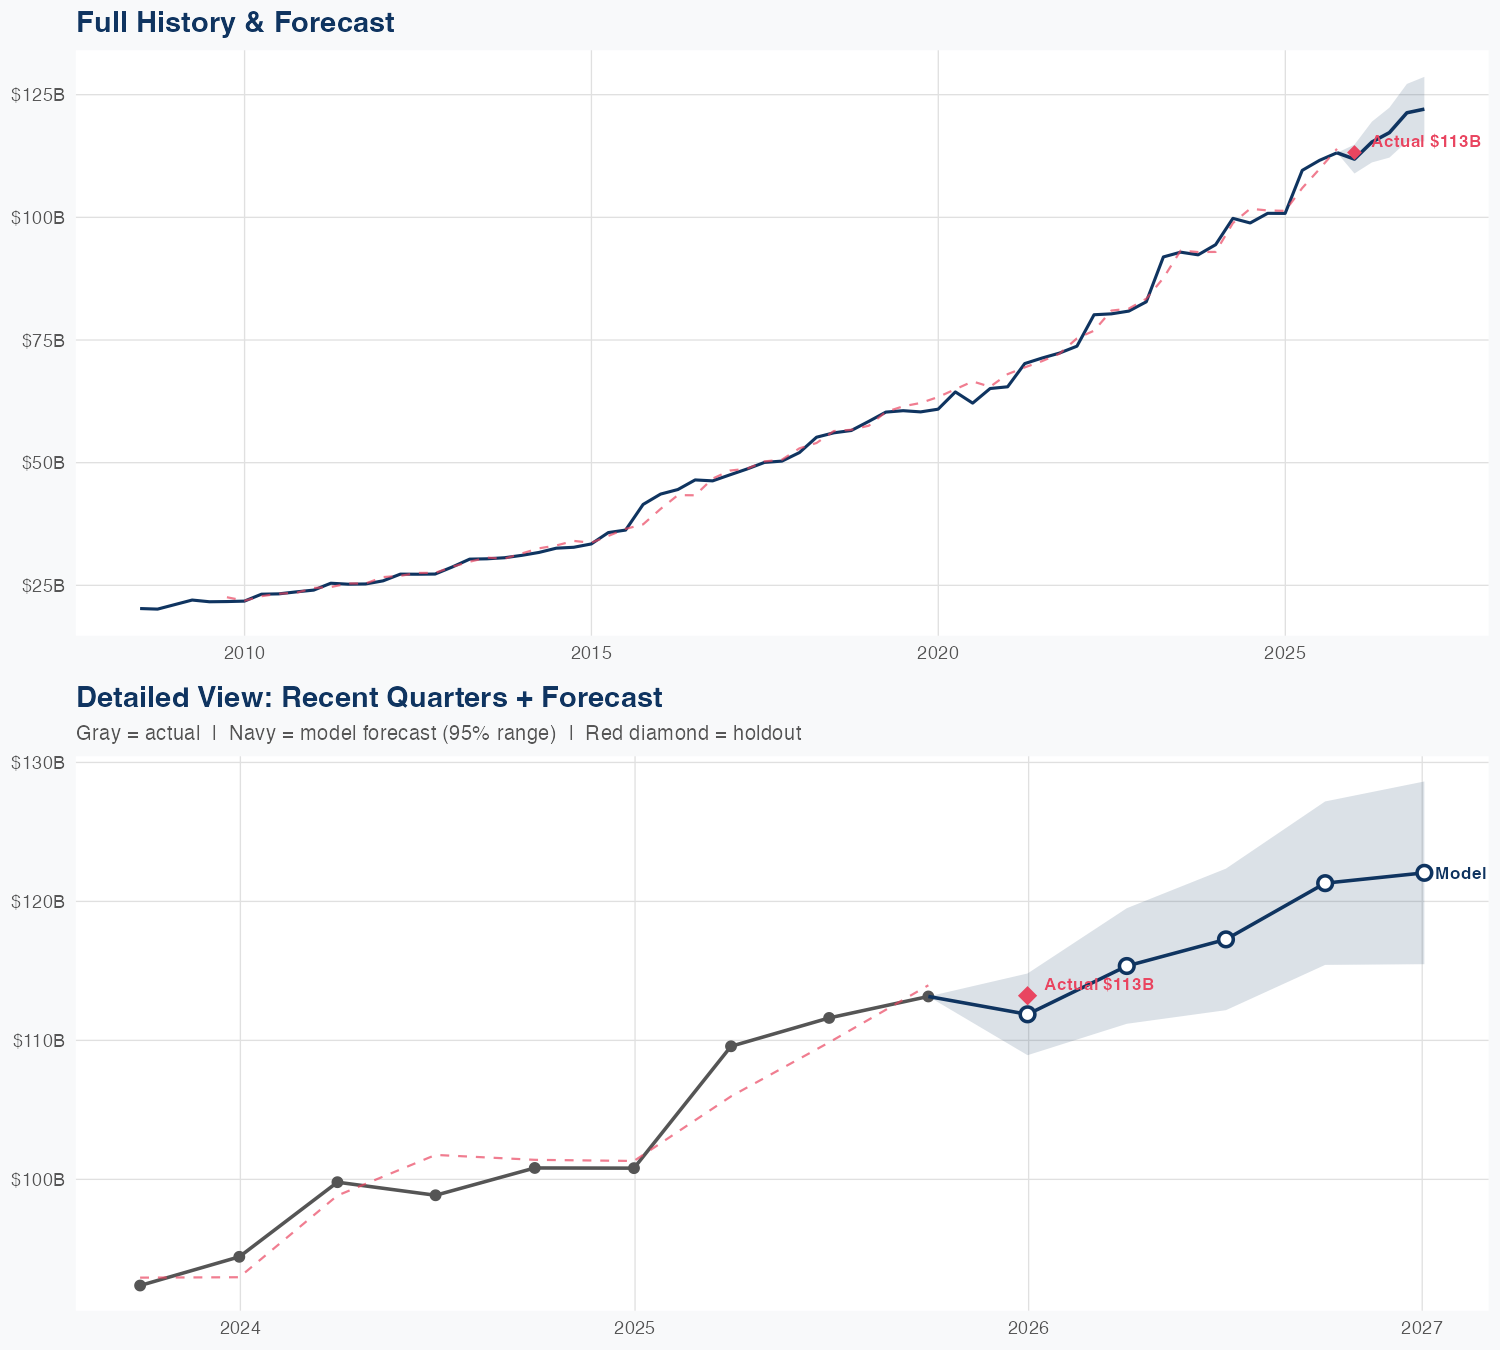
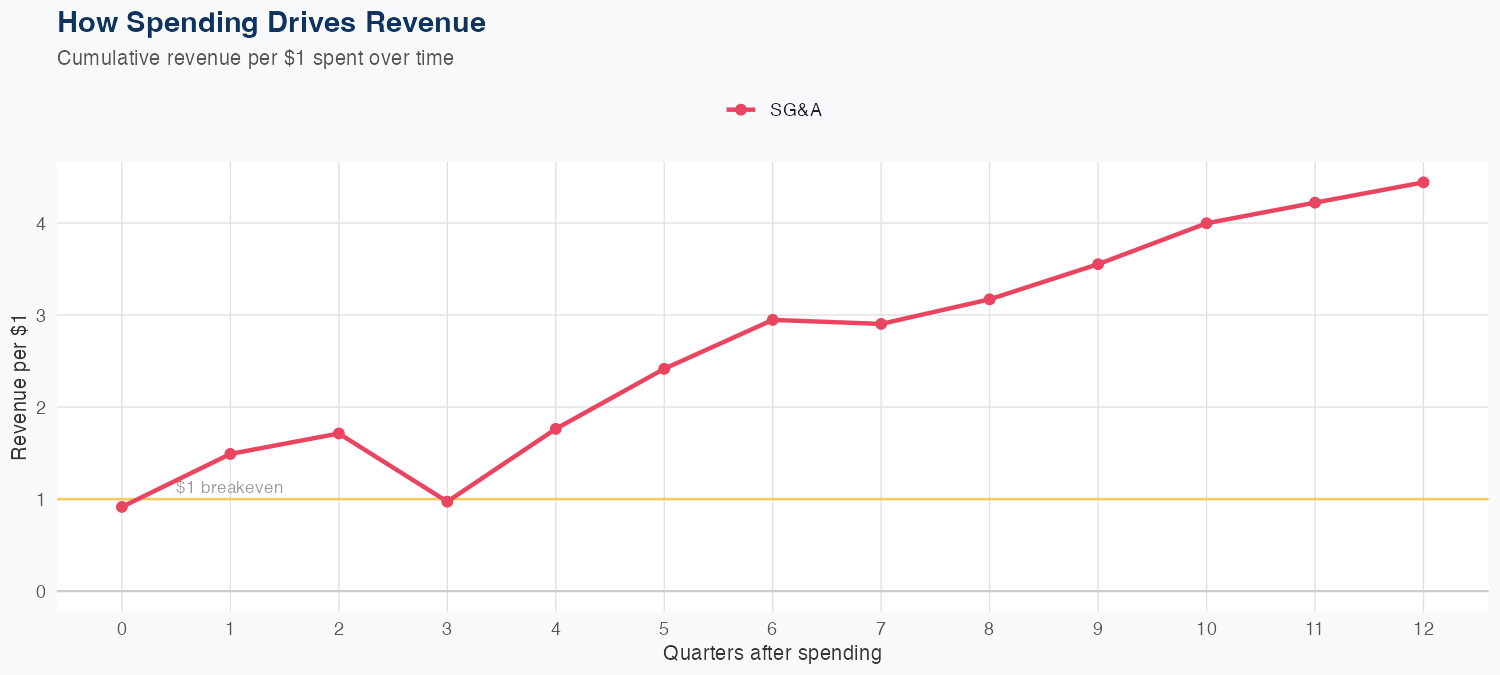
Our econometric model indicates UNH’s 6.4% revenue uptick is driven by growth leverage in scale and efficiency, not just price or member gains. With SG&A ROI of 4.44x, each dollar of selling, general, and administrative spend is associated with about $4.44 of revenue, implying incremental spend in sales/ops and Optum services materially amplifies growth. The elasticity signals the strongest drivers are platform-enabled components—Medicare Advantage and Optum care/analytics—where investments yield outsized returns rather than simple margin expansion. The holdout error around -1% (predicted 112B vs actual 113B) and 1.8% MAPE point to solid forecast reliability, albeit with a small downside bias. Risks include policy shifts, payer mix changes, and cost inflation that could compress SG&A ROI and earnings growth.
Investment Thesis
Our ARDL model tracks Unitedhealth Group Incorporated's revenue with exceptional precision (1.8% MAPE), indicating highly predictable cash flows. Each $1 of SG&A spending generates $4.44 in revenue, reflecting strong commercial efficiency.
Revenue Forecast
Quarterly Detail
| Quarter | Model Forecast | Actual | 95% Range | YoY Growth | Status |
|---|---|---|---|---|---|
| Q4 2025 | $112B | $113B | $109B – $115B | +11.0% | ✓ In range |
| Q2 2026 | $115B | $111B – $120B | +5.3% | ||
| Q3 2026 | $117B | $112B – $122B | +5.1% | ||
| Q4 2026 | $121B | $115B – $127B | +7.2% | ||
| Q1 2027 | $122B | $115B – $129B | +7.8% |
Seasonal Factors
| Fiscal Quarter | Seasonal Factor | vs Trend | Interpretation | Obs. |
|---|---|---|---|---|
| FQ1 (Sep–Nov) | 0.9942 | -0.6% | In line with trend | 17 |
| FQ2 (Dec–Feb) | 0.9899 | -1.0% | In line with trend | 17 |
| FQ3 (Mar–May) | 1.0178 | +1.8% | In line with trend | 16 |
| FQ4 (Jun–Aug) | 0.9936 | -0.6% | In line with trend | 16 |
How Spending Drives Revenue
Want this analysis for your portfolio?
I build custom revenue intelligence reports for investors and companies using SEC filing data, econometric modeling, and AI-powered insights.
Get in Touch