Williams Companies, Inc. WMB
Revenue Intelligence Report • 69 quarters of SEC filing data • Updated 2026-03-15
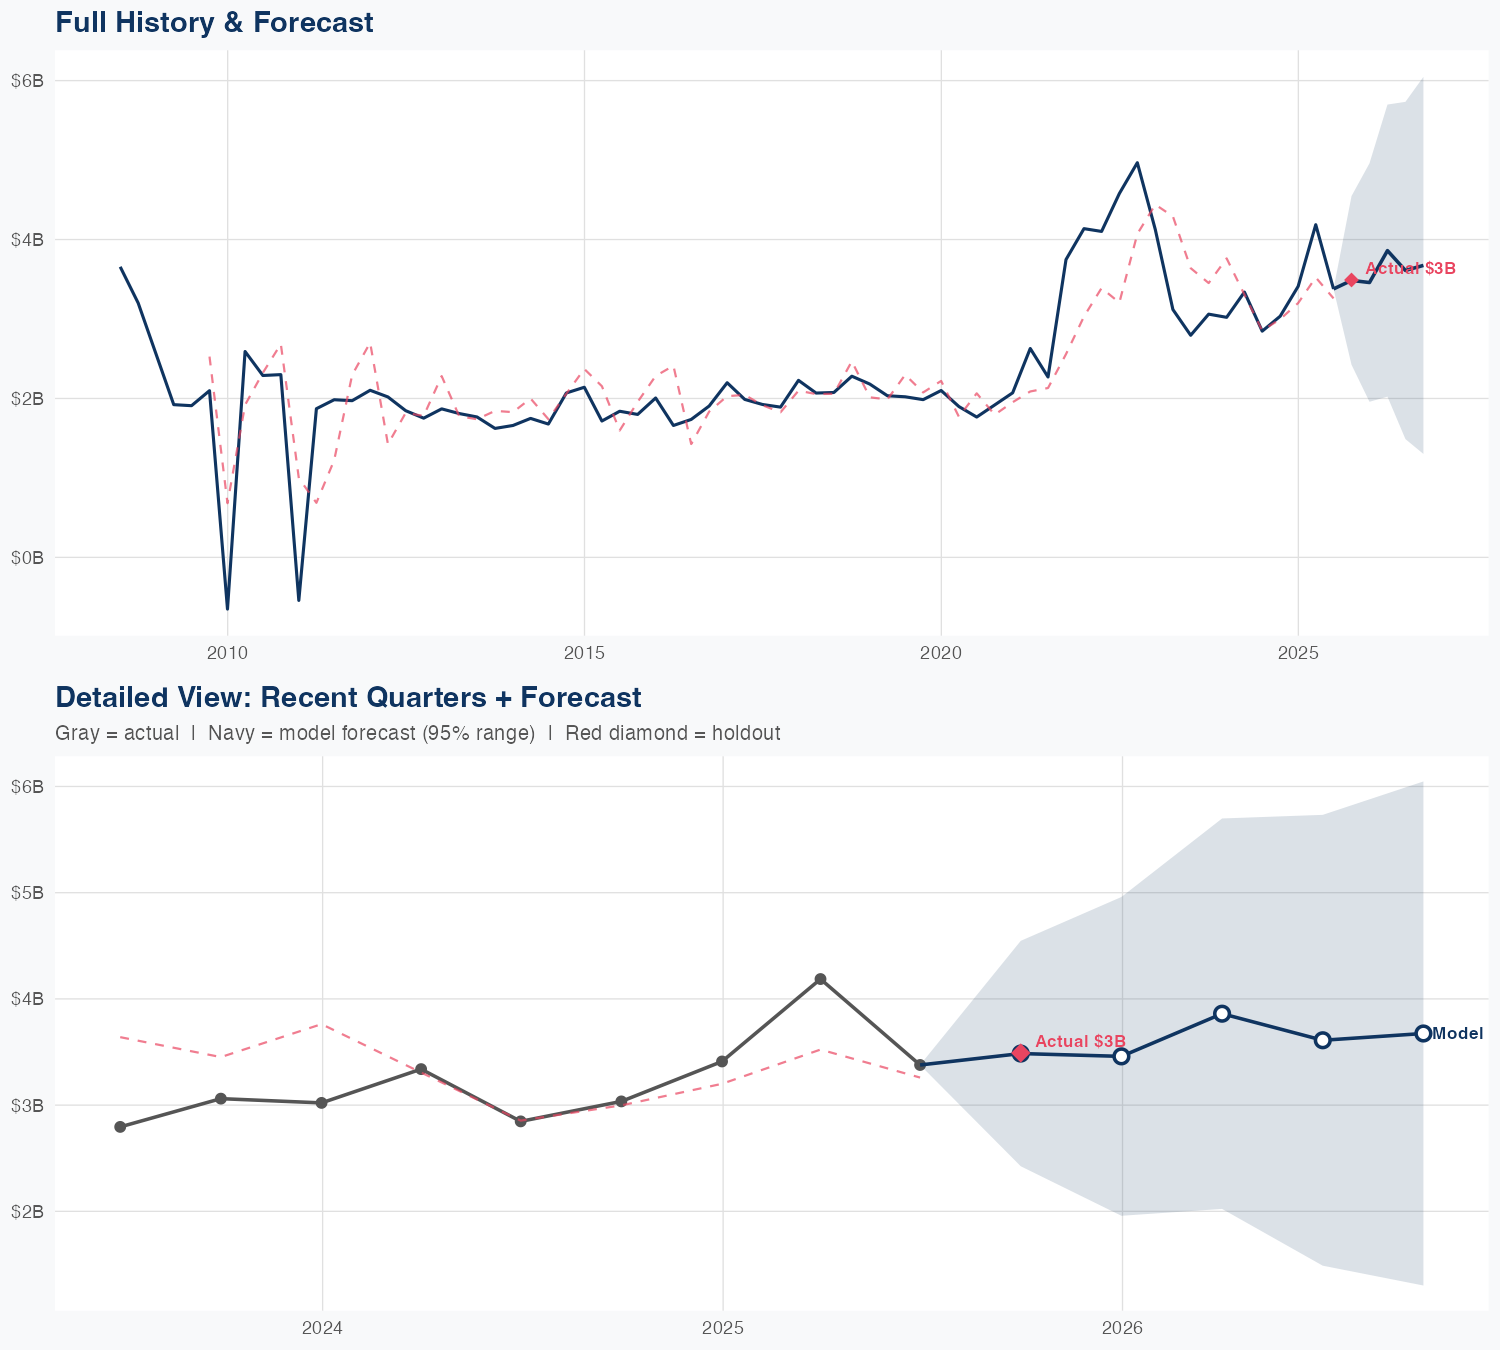
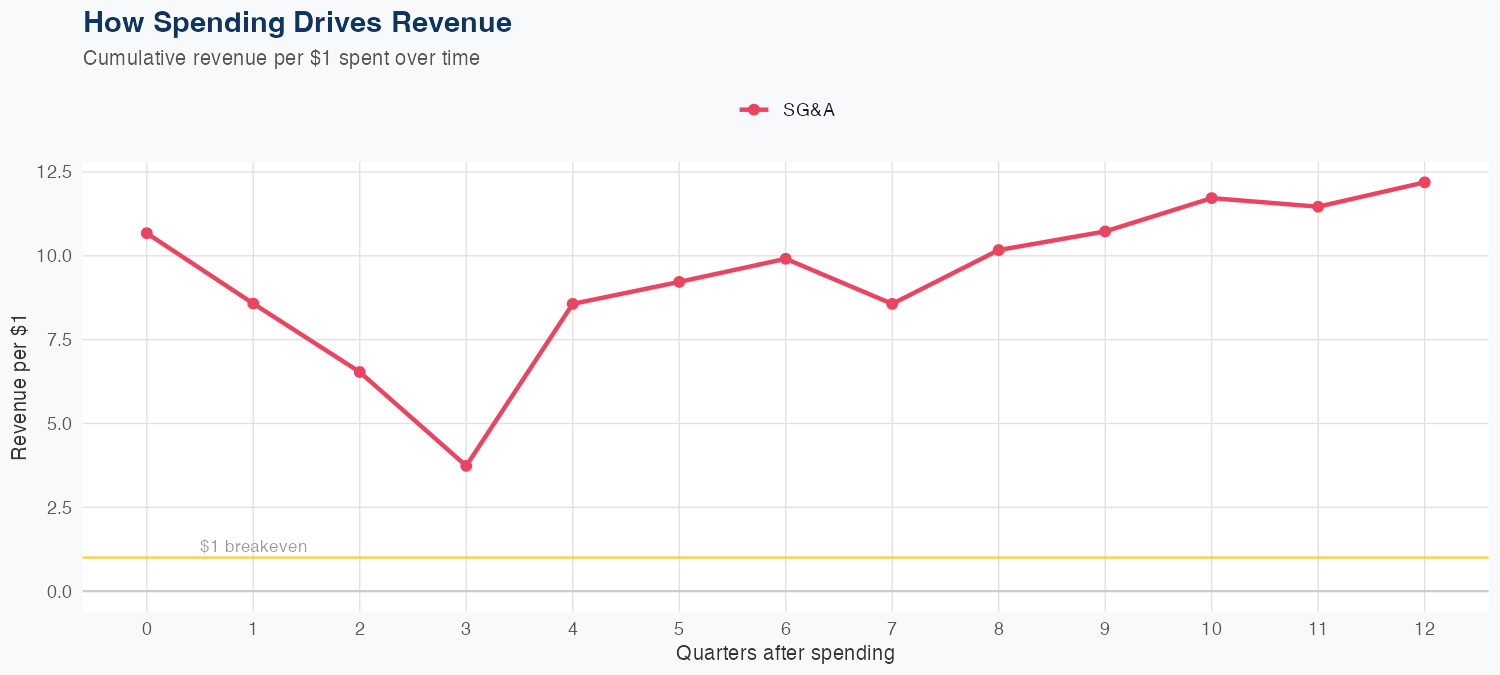
Revenue is driven by the company’s core midstream operations, with the latest quarterly revenue about $2.92 billion and a 69-quarter data history underpinning a linear forecasting approach. The model implies a strong return on SG&A, estimating that each $1 of SG&A spend yields about $15.43 in long-run revenue, highlighting SG&A leverage as a key revenue driver. In out-of-sample tests, the model predicted $2.8B vs. actual $2.9B (3.4% error), with an overall MAPE of 15.9%, indicating reasonable forecast accuracy given the data. The FY forecast calls for about $12B in revenue, up roughly 3.5% year over year, suggesting a modest growth trajectory anchored by core asset economics and SG&A efficiency, while R&D data is not available in the dataset.
Investment Thesis
At 15.9% MAPE, the model captures Williams Companies, Inc.'s broad revenue trajectory, though quarterly variability suggests sensitivity to external factors. Each $1 of SG&A spending generates $15.43 in revenue, reflecting strong commercial efficiency.
Revenue Forecast
Quarterly Detail
| Quarter | Model Forecast | Actual | 95% Range | YoY Growth | Status |
|---|---|---|---|---|---|
| Q3 2025 | $2.8B | $2.9B | $2.1B – $3.5B | +6.4% | ✓ In range |
| Q4 2025 | $2.9B | $1.9B – $3.9B | +5.8% | ||
| Q2 2026 | $3.1B | $1.9B – $4.3B | +1.9% | ||
| Q3 2026 | $2.9B | $1.5B – $4.3B | +4.7% | ||
| Q4 2026 | $3.0B | $1.4B – $4.5B | +1.9% |
Seasonal Factors
| Fiscal Quarter | Seasonal Factor | vs Trend | Interpretation | Obs. |
|---|---|---|---|---|
| FQ1 (Sep–Nov) | 1.0051 | +0.5% | In line with trend | 17 |
| FQ2 (Dec–Feb) | 0.937 | -6.3% | -6.3% below trend | 16 |
| FQ3 (Mar–May) | 1.0855 | +8.5% | +8.5% above trend | 16 |
| FQ4 (Jun–Aug) | 1.0761 | +7.6% | +7.6% above trend | 16 |
How Spending Drives Revenue
Want this analysis for your portfolio?
I build custom revenue intelligence reports for investors and companies using SEC filing data, econometric modeling, and AI-powered insights.
Get in Touch