Williams-Sonoma, Inc. WSM
Revenue Intelligence Report • 59 quarters of SEC filing data • Updated 2026-03-15
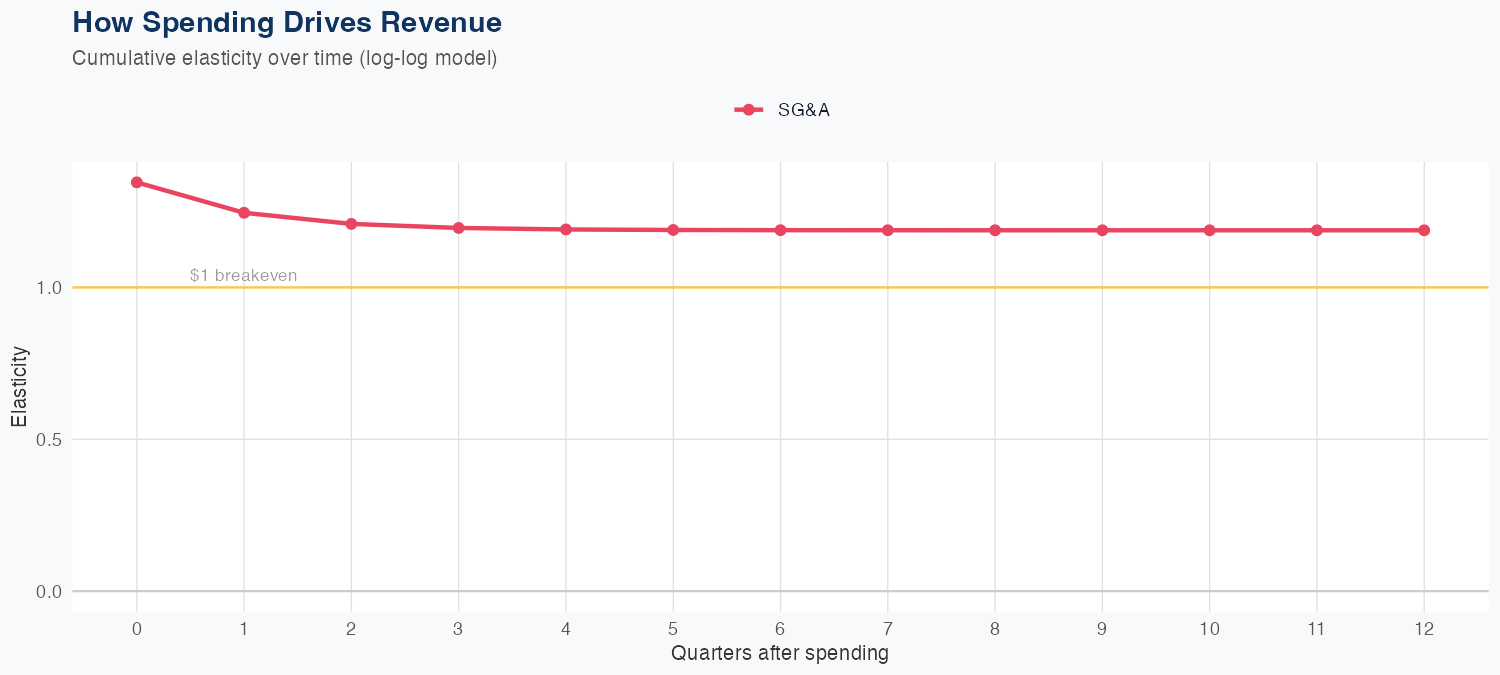
Revenue is primarily driven by SG&A investments, with a 1% increase in SG&A associated with a 1.19% rise in revenue, making SG&A the key growth lever. The model uses a log-log specification over 59 quarters, delivering 4.0% MAPE and a holdout test with predicted $1.9B vs actual $1.9B (−2.8% error), indicating solid near-term predictive power. The latest quarterly revenue is $1.883B, and the full-year forecast is $8.0B, up about 1.3% year over year. The implied ROI on SG&A spending appears positive (roughly 1.19x revenue lift per 1x SG&A), though the absence of R&D data means potential innovation spend ROI remains unclear; ongoing SG&A discipline and effectiveness will be key to upside.
Investment Thesis
The econometric model achieves strong accuracy (4.0% MAPE), suggesting Williams-Sonoma, Inc.'s revenue trajectory is well-characterized by its spending patterns. Sales & marketing spend shows a 1.19x elasticity, suggesting effective go-to-market execution.
Revenue Forecast
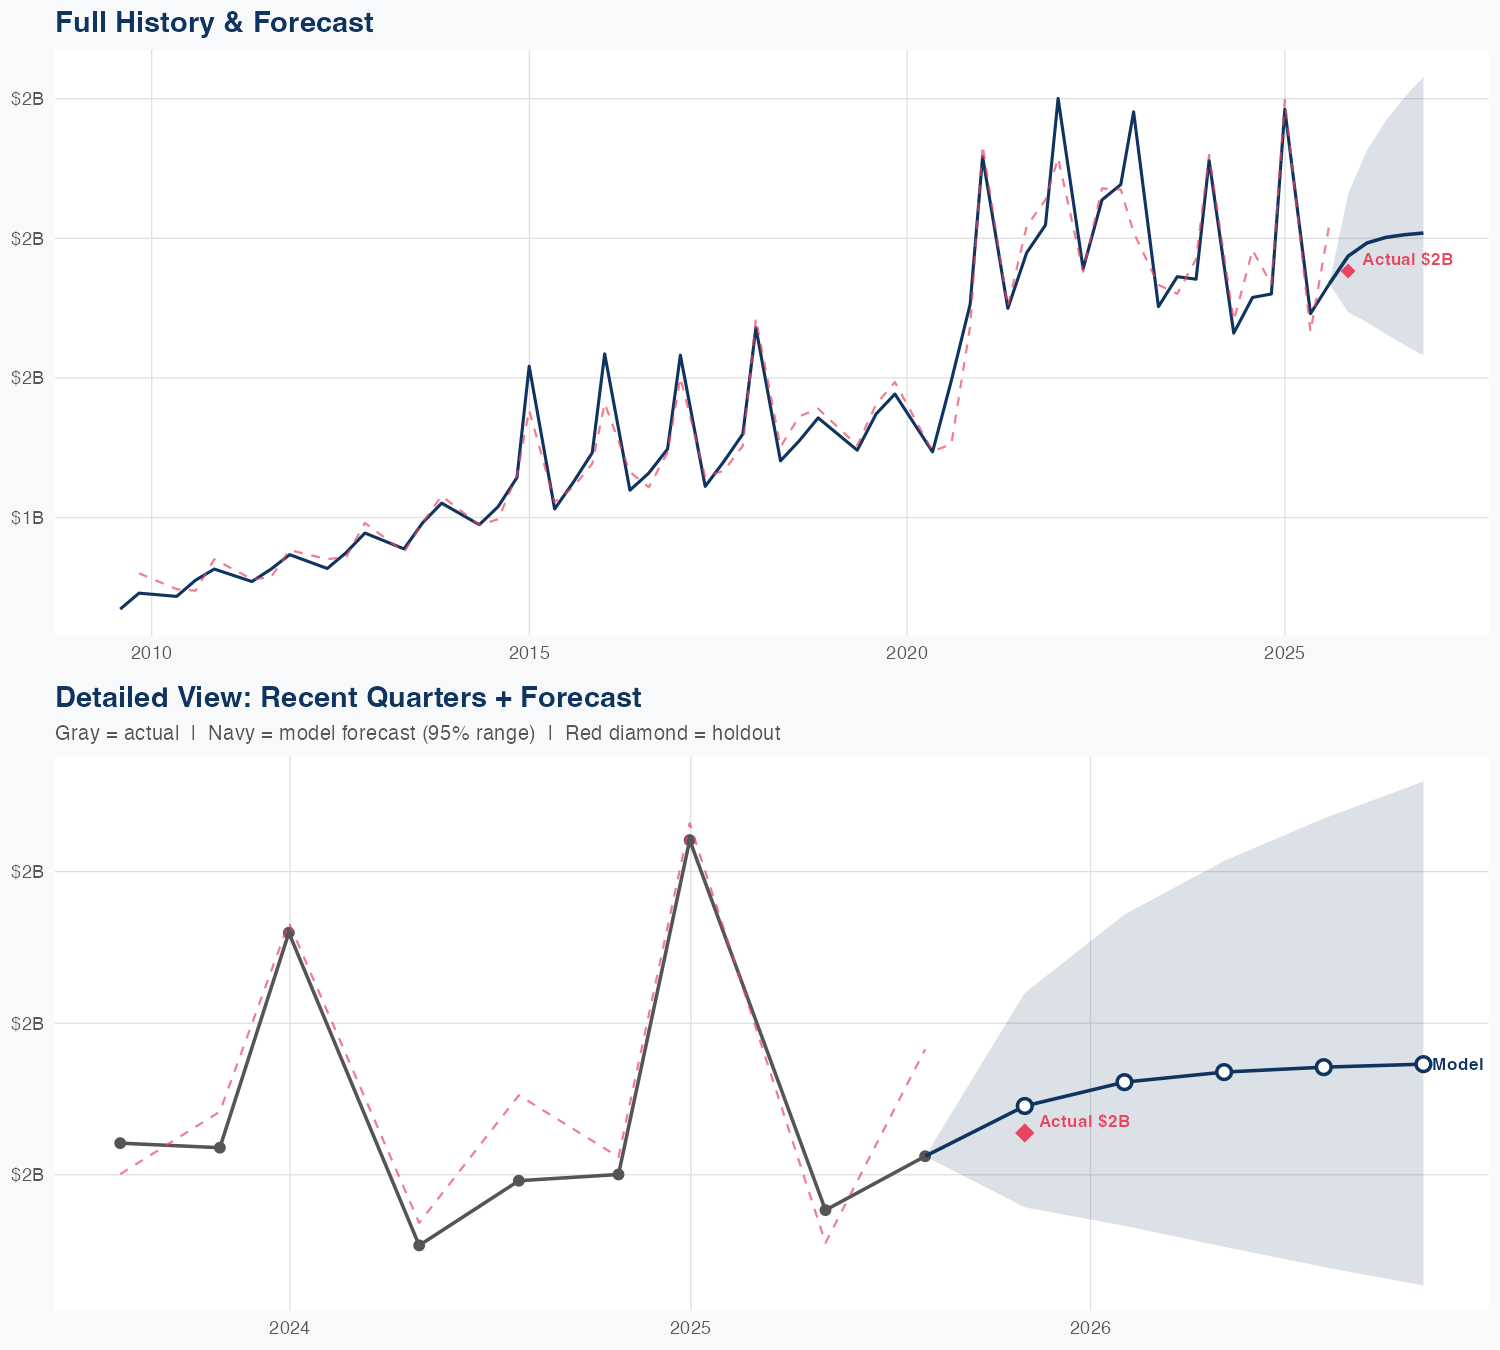
Quarterly Detail
| Quarter | Model Forecast | Actual | 95% Range | YoY Growth | Status |
|---|---|---|---|---|---|
| Q4 2025 | $1.9B | $1.9B | $1.7B – $2.2B | +7.5% | ✓ In range |
| Q1 2026 | $2.0B | $1.7B – $2.3B | -19.4% | ||
| Q2 2026 | $2.0B | $1.7B – $2.4B | +15.8% | ||
| Q3 2026 | $2.0B | $1.6B – $2.5B | +9.6% | ||
| Q4 2026 | $2.0B | $1.6B – $2.6B | +7.2% |
Seasonal Factors
| Fiscal Quarter | Seasonal Factor | vs Trend | Interpretation | Obs. |
|---|---|---|---|---|
| FQ1 (Sep–Nov) | 0.9762 | -2.4% | In line with trend | 17 |
| FQ2 (Dec–Feb) | 1.0537 | +5.4% | +5.4% above trend | 9 |
| FQ3 (Mar–May) | 0.9864 | -1.4% | In line with trend | 16 |
| FQ4 (Jun–Aug) | 1.0184 | +1.8% | In line with trend | 16 |
How Spending Drives Revenue
Want this analysis for your portfolio?
I build custom revenue intelligence reports for investors and companies using SEC filing data, econometric modeling, and AI-powered insights.
Get in Touch