Wynn Resorts, Limited WYNN
Revenue Intelligence Report • 66 quarters of SEC filing data • Updated 2026-03-15
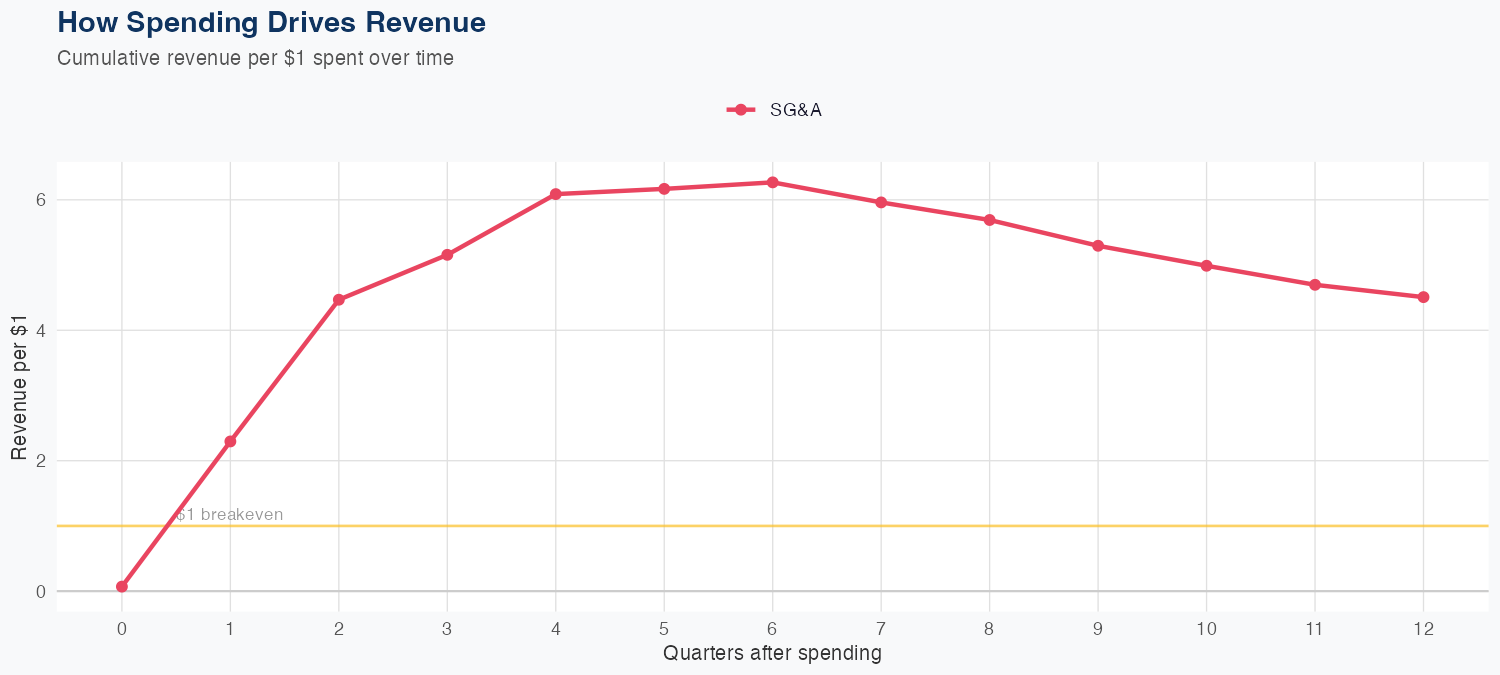
Revenue is driven by casino gaming and hospitality demand, with the latest quarterly revenue at 1.866 billion dollars. The analysis shows a strong ROI on SG&A spending, with every $1 of SG&A expected to generate $2.33 in long-run revenue. The model is linear and moderately accurate (MAPE 17.3%), with a holdout test predicting 1.8B vs 1.9B actual (5.8% error), indicating reasonable credibility with some uncertainty. For the full year, revenue is forecast at $6.6B, down 7% year over year, underscoring near-term headwinds and highlighting SG&A efficiency and macro travel demand as key levers for potential upside.
Investment Thesis
At 17.3% MAPE, the model captures Wynn Resorts, Limited's broad revenue trajectory, though quarterly variability suggests sensitivity to external factors. Each $1 of SG&A spending generates $2.33 in revenue, reflecting strong commercial efficiency.
Revenue Forecast
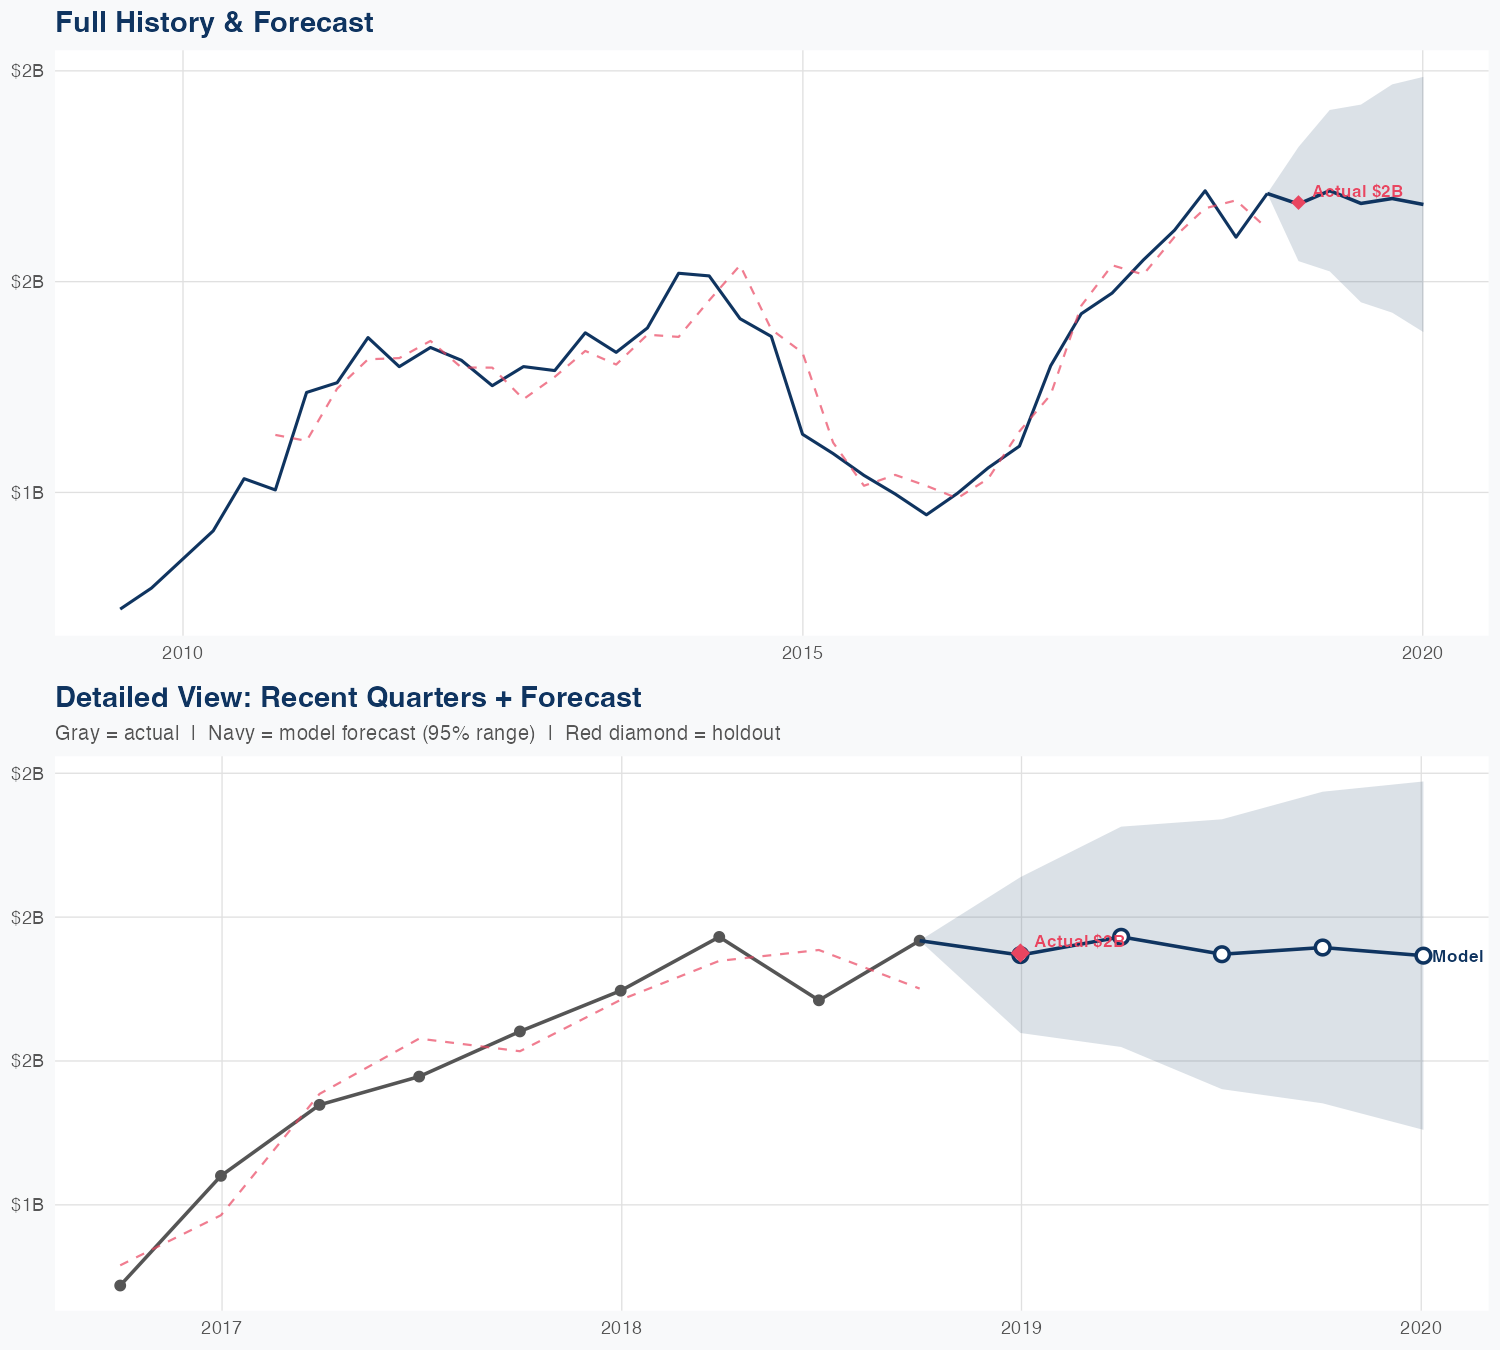
Quarterly Detail
| Quarter | Model Forecast | Actual | 95% Range | YoY Growth | Status |
|---|---|---|---|---|---|
| Q4 2025 | $1.8B | $1.9B | $1.5B – $2.0B | -4.4% | ✓ In range |
| Q2 2026 | $1.7B | $1.3B – $2.1B | +0.8% | ||
| Q3 2026 | $1.7B | $1.2B – $2.2B | -3.6% | ||
| Q4 2026 | $1.6B | $1.1B – $2.2B | -10.7% | ||
| Q1 2027 | $1.6B | $1.0B – $2.3B | -13.8% |
Seasonal Factors
| Fiscal Quarter | Seasonal Factor | vs Trend | Interpretation | Obs. |
|---|---|---|---|---|
| FQ1 (Sep–Nov) | 0.9908 | -0.9% | In line with trend | 16 |
| FQ2 (Dec–Feb) | 1.0306 | +3.1% | +3.1% above trend | 16 |
| FQ3 (Mar–May) | 1.0022 | +0.2% | In line with trend | 15 |
| FQ4 (Jun–Aug) | 1.0064 | +0.6% | In line with trend | 15 |
How Spending Drives Revenue
Want this analysis for your portfolio?
I build custom revenue intelligence reports for investors and companies using SEC filing data, econometric modeling, and AI-powered insights.
Get in Touch