Applied Materials Inc /De AMAT
Revenue Intelligence Report • 50 quarters of SEC filing data • Updated 2026-03-15
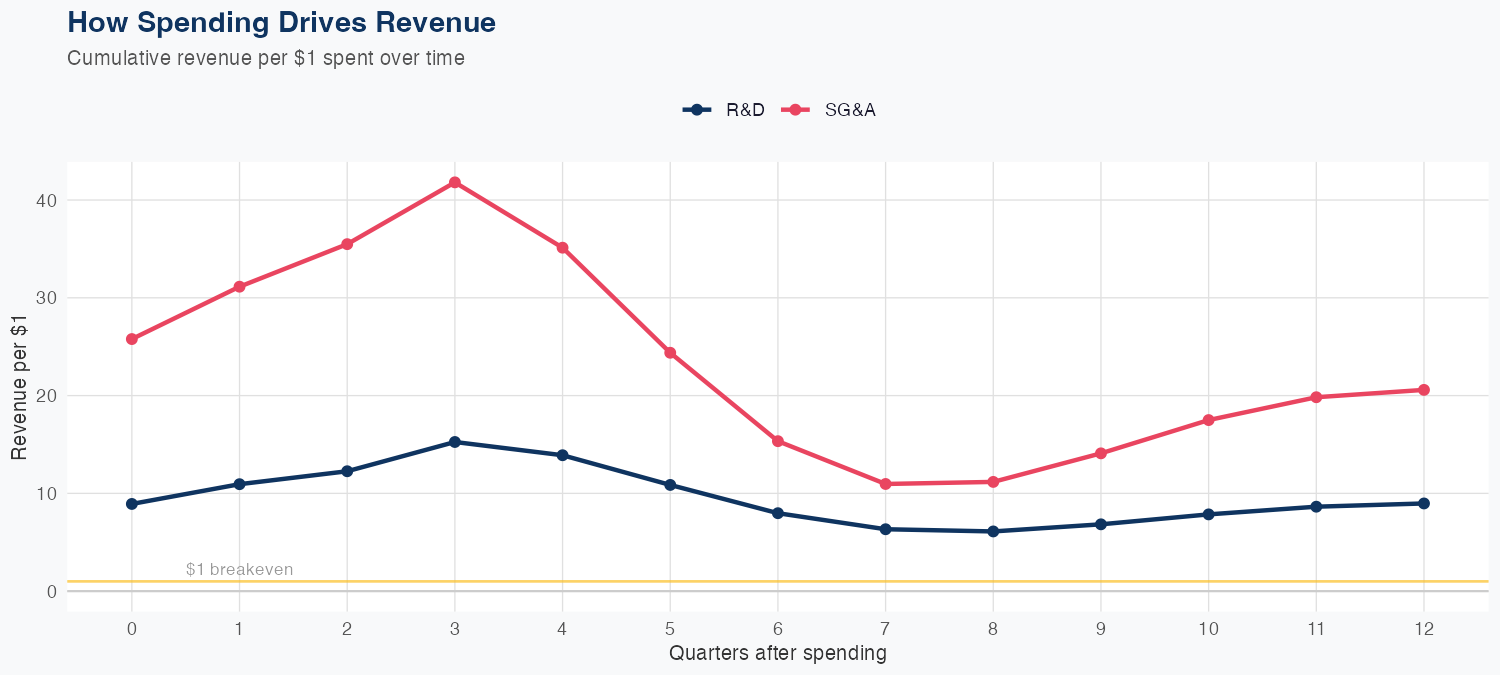
Revenue is driven by spend efficiency, with each $1 of SG&A generating about $20.58 of long-run revenue and each $1 of R&D generating about $8.97, as estimated by a linear model trained on 50 quarters of data. The latest quarterly revenue was $7.012 billion, and holdout testing produced a predicted $7.5B vs actual $7.0B, a -7.6% error, with a model MAPE of 3.6%. The full-year forecast calls for about $32 billion in revenue, up 11.3% year over year, signaling solid top-line momentum. Taken together, the ROI on SG&A suggests higher efficiency and the forecasted growth supports a constructive outlook for investors.
Investment Thesis
The econometric model achieves strong accuracy (3.6% MAPE), suggesting Applied Materials Inc /De's revenue trajectory is well-characterized by its spending patterns. Every $1 of R&D investment is associated with $8.97 of revenue, indicating efficient capital deployment in innovation. Each $1 of SG&A spending generates $20.58 in revenue, reflecting strong commercial efficiency.
Revenue Forecast
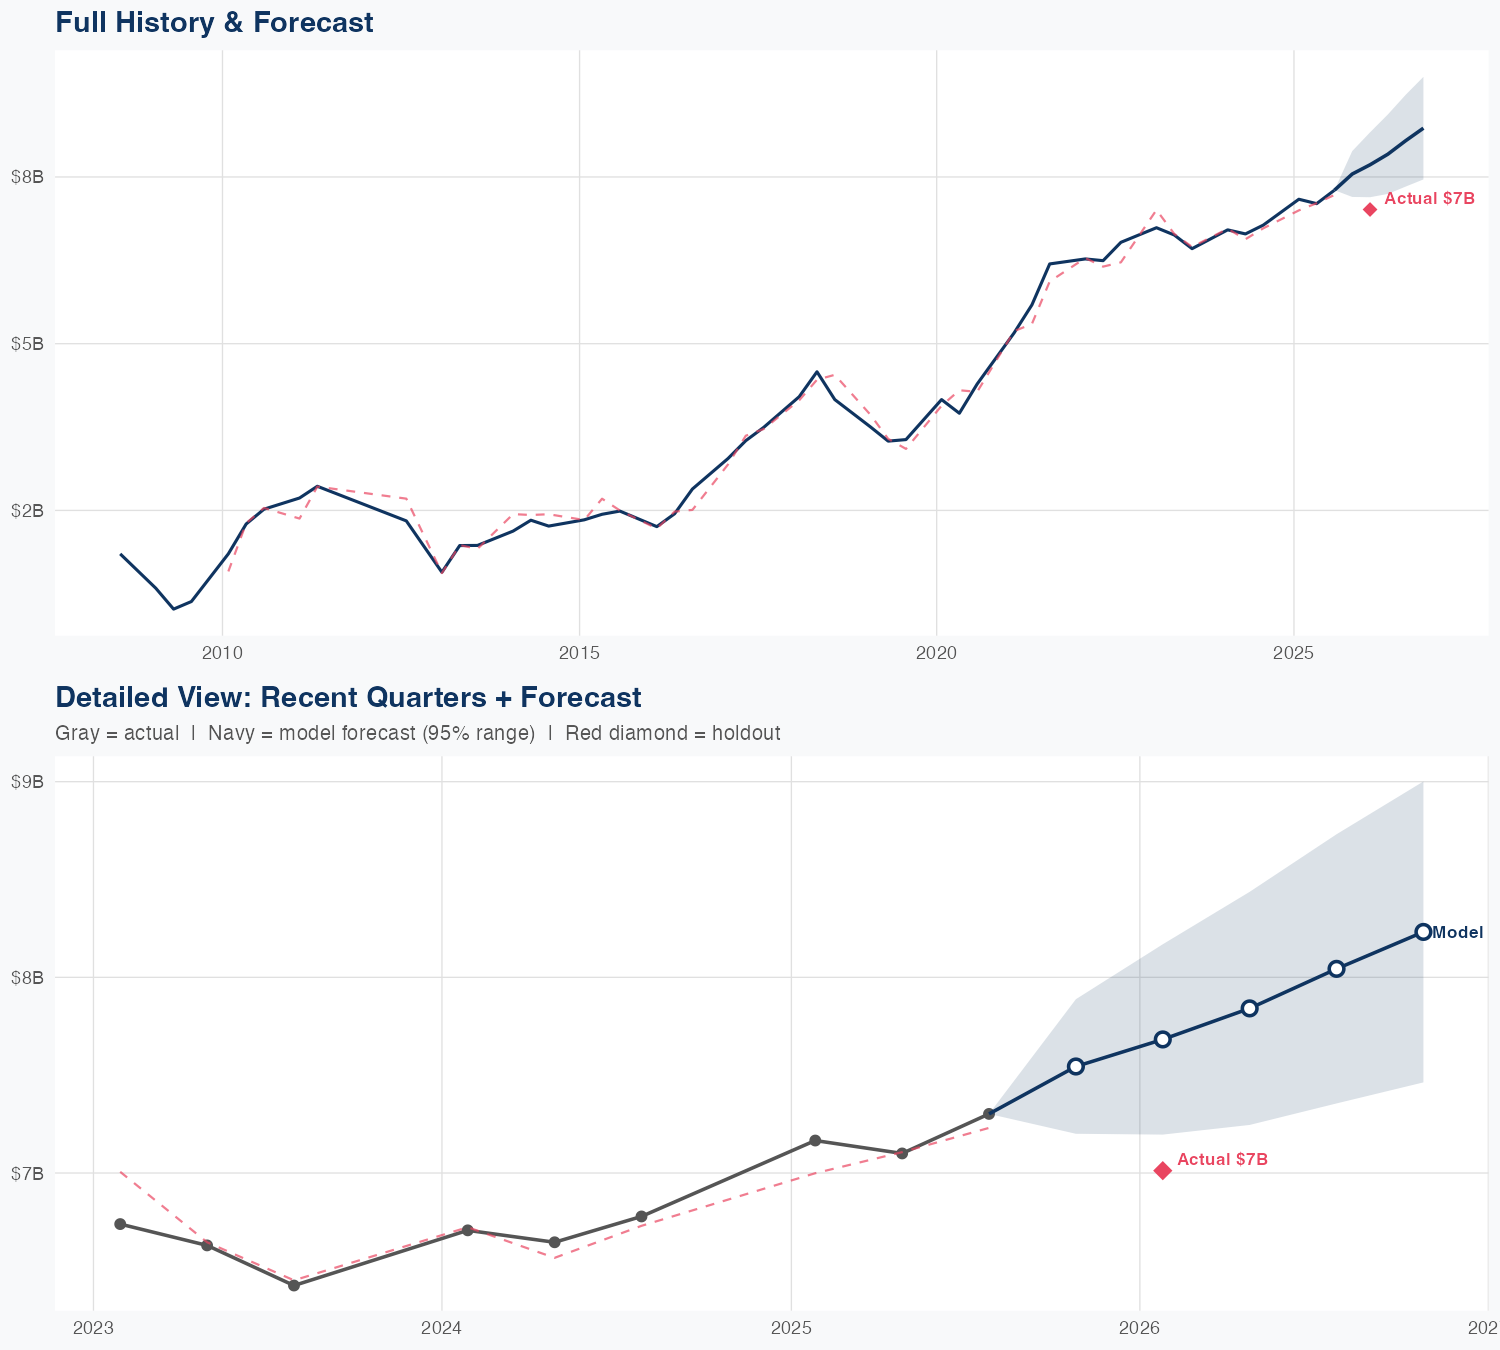
Quarterly Detail
| Quarter | Model Forecast | Actual | 95% Range | YoY Growth | Status |
|---|---|---|---|---|---|
| Q4 2025 | $7.5B | $7.0B | $7.2B – $7.9B | +11.3% | ✗ Outside range |
| Q1 2026 | $7.7B | $7.2B – $8.2B | +7.2% | ||
| Q2 2026 | $7.8B | $7.2B – $8.4B | +10.4% | ||
| Q3 2026 | $8.0B | $7.4B – $8.7B | +10.2% | ||
| Q4 2026 | $8.2B | $7.5B – $9.0B | +17.4% |
Seasonal Factors
| Fiscal Quarter | Seasonal Factor | vs Trend | Interpretation | Obs. |
|---|---|---|---|---|
| FQ1 (Sep–Nov) | 1.0 | +0.0% | In line with trend | 0 |
| FQ2 (Dec–Feb) | 1.0082 | +0.8% | In line with trend | 16 |
| FQ3 (Mar–May) | 0.9967 | -0.3% | In line with trend | 15 |
| FQ4 (Jun–Aug) | 1.0071 | +0.7% | In line with trend | 15 |
How Spending Drives Revenue
Want this analysis for your portfolio?
I build custom revenue intelligence reports for investors and companies using SEC filing data, econometric modeling, and AI-powered insights.
Get in Touch