Ametek, inc. AME
Revenue Intelligence Report • 8 quarters of SEC filing data • Updated 2026-03-15
Ametek, inc. has a forecasted full-year revenue of $7.5B, a +1.5% year-over-year change, based on 8 quarters of SEC filing data. Key revenue drivers include SG&A ($6.38 per $1). The ARDL model achieves strong accuracy at 0.6% MAPE.
Investment Thesis
Our ARDL model tracks Ametek, inc.'s revenue with exceptional precision (0.6% MAPE), indicating highly predictable cash flows. Each $1 of SG&A spending generates $6.38 in revenue, reflecting strong commercial efficiency.
Next FY Revenue
$7.51B
+1.5% YoY
SG&A Multiplier
$6.38 per $1
Model Accuracy
0.6% MAPE
Holdout validation: The model predicted $1.8B vs the actual $2.0B — an error of 8.0%.
Note:
Ametek, inc. does not report R&D expenses separately. This analysis uses SG&A spending only.
Revenue Forecast
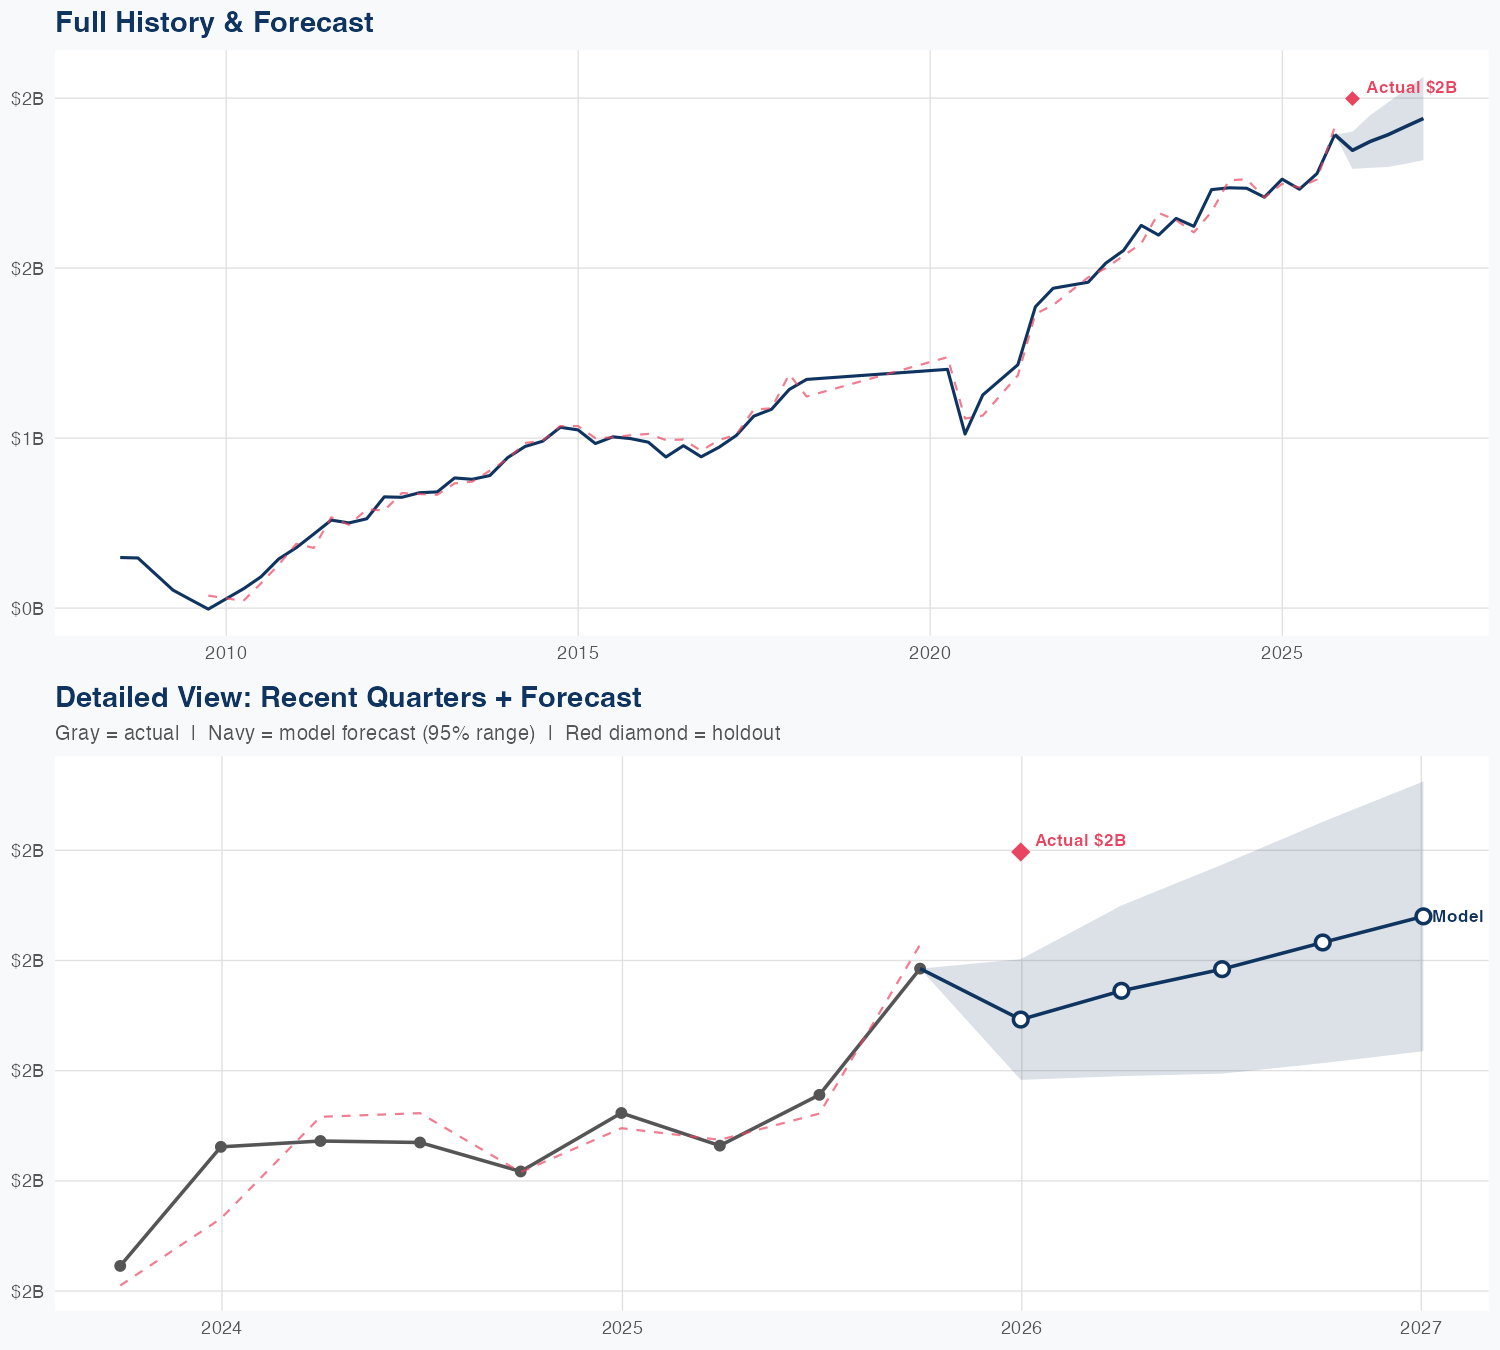
Quarterly Detail
| Quarter | Model Forecast | Actual | 95% Range | YoY Growth | Status |
|---|---|---|---|---|---|
| Q4 2025 | $1.8B | $2.0B | $1.8B – $1.9B | +4.4% | ✗ Outside range |
| Q2 2026 | $1.9B | $1.8B – $1.9B | +7.1% | ||
| Q3 2026 | $1.9B | $1.8B – $1.9B | +5.2% | ||
| Q4 2026 | $1.9B | $1.8B – $1.9B | -0.4% | ||
| Q1 2027 | $1.9B | $1.8B – $2.0B | -4.9% |
How Spending Drives Revenue
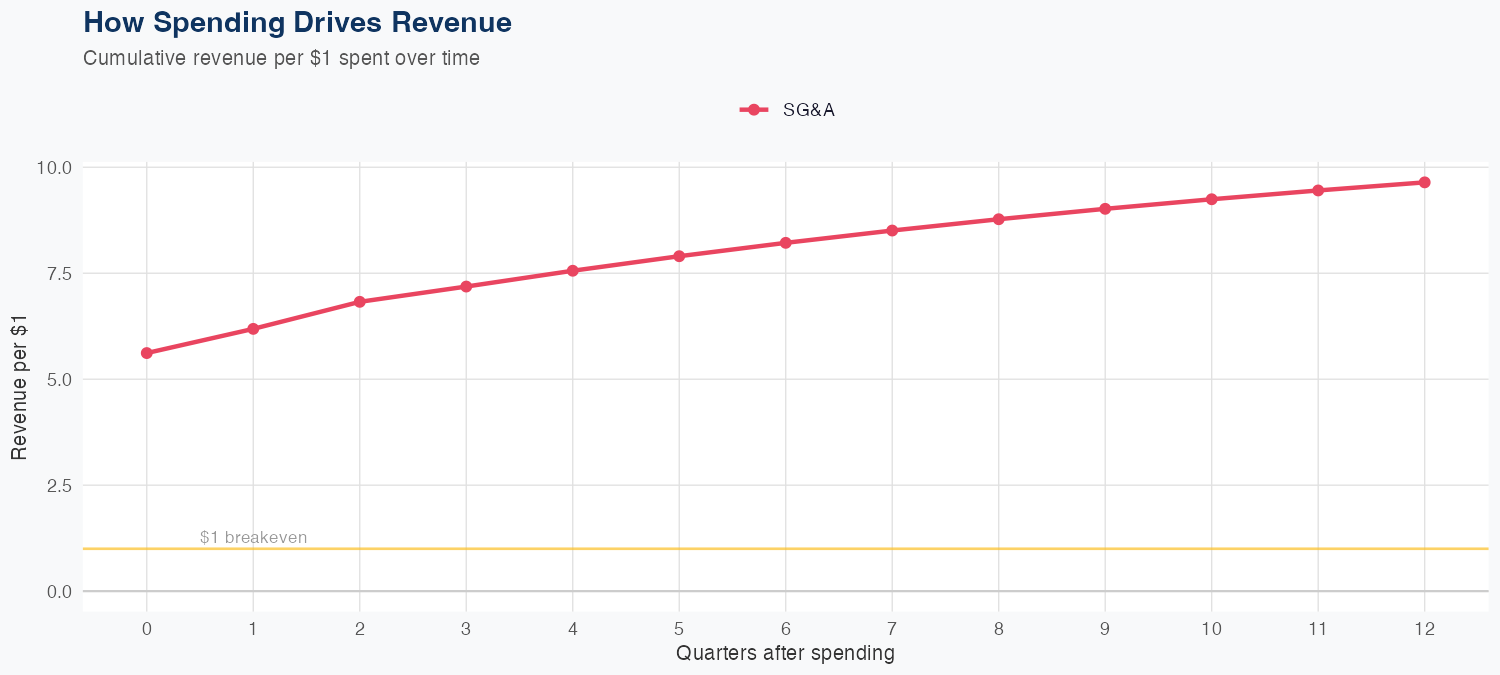
Reading this chart:
Each line shows the cumulative revenue generated per $1 spent over subsequent quarters. The effect builds over 4-5 quarters as investments mature.
Want this analysis for your portfolio?
I build custom revenue intelligence reports for investors and companies using SEC filing data, econometric modeling, and AI-powered insights.
Get in Touch