A. O. Smith Corporation AOS
Revenue Intelligence Report • 36 quarters of SEC filing data • Updated 2026-03-15
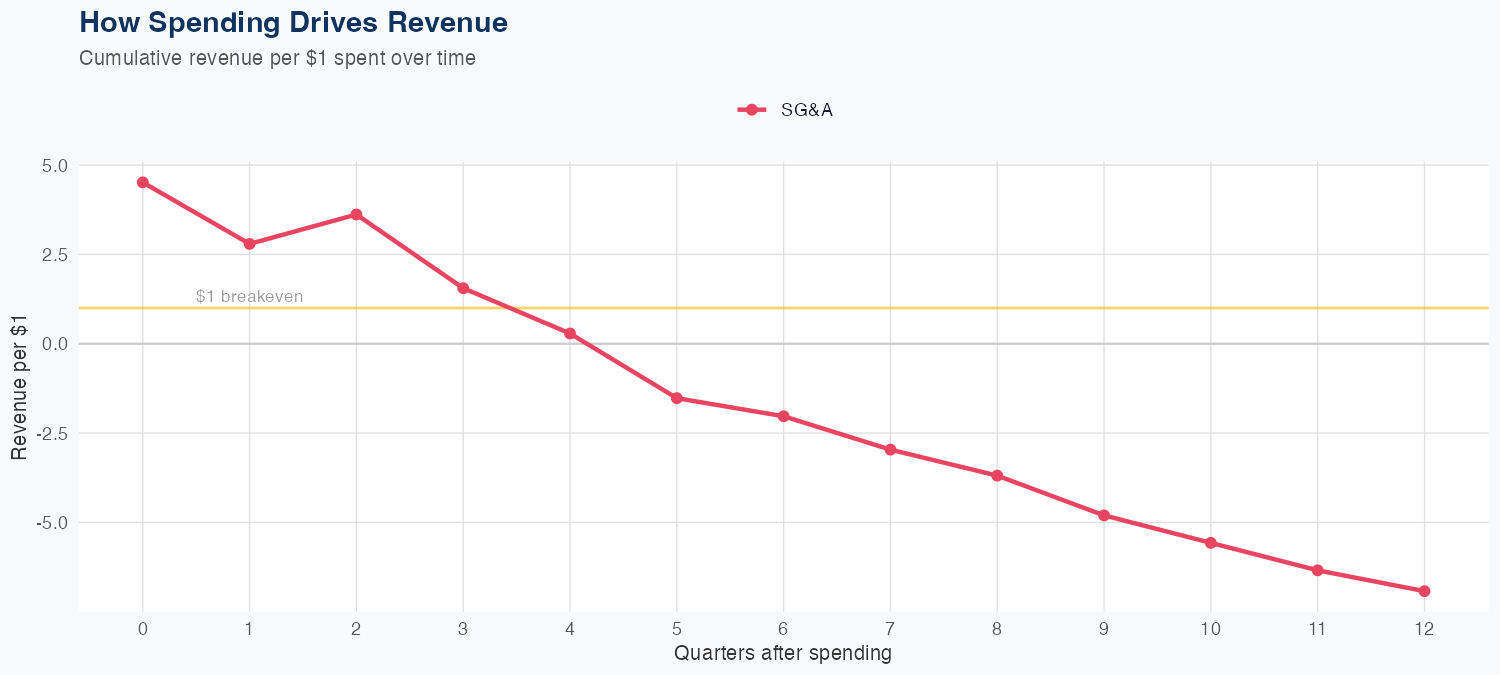
Revenue appears driven by SG&A dynamics, with a 1% uptick in SG&A associated with a 0.68% decrease in revenue, indicating limited or negative ROI from SG&A spending under the current model. The model uses a log-log specification over 36 quarters and delivers solid accuracy, with a 4.0% MAPE and a holdout test error of about -2% (predicted $0.9B vs actual $0.9B), supporting confidence in near-term forecasts. The latest quarterly revenue is approximately $912 million, and full-year revenue is forecast at $3.6 billion, down 5.3% year over year, signaling near-term headwinds. Without R&D data, growth drivers beyond SG&A efficiency are unclear; investors should focus on SG&A optimization and cost discipline to support any upside, given the revenue decline.
Investment Thesis
The econometric model achieves strong accuracy (4.0% MAPE), suggesting A. O. Smith Corporation's revenue trajectory is well-characterized by its spending patterns.
Revenue Forecast
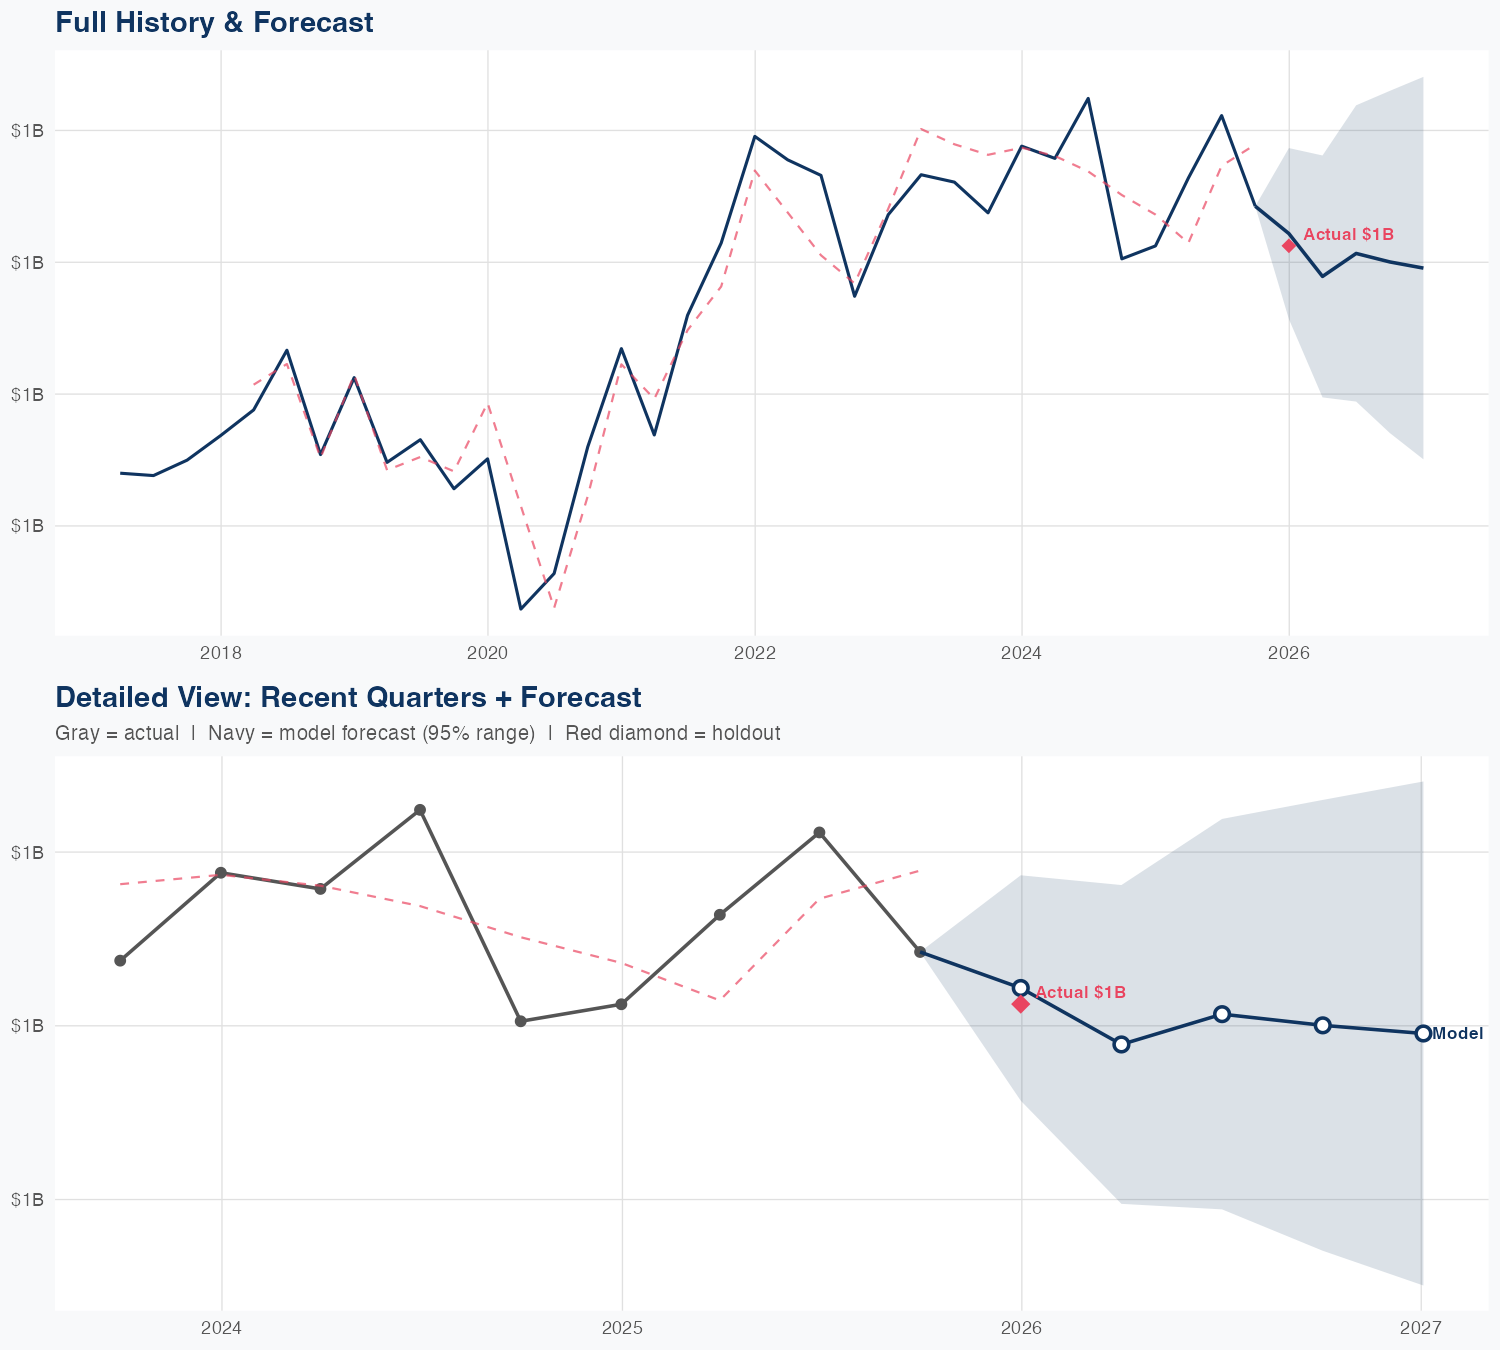
Quarterly Detail
| Quarter | Model Forecast | Actual | 95% Range | YoY Growth | Status |
|---|---|---|---|---|---|
| Q4 2025 | $0.9B | $0.9B | $0.8B – $1.0B | +2.0% | ✓ In range |
| Q2 2026 | $0.9B | $0.8B – $1.1B | -4.6% | ||
| Q3 2026 | $0.9B | $0.8B – $1.1B | -9.9% | ||
| Q4 2026 | $0.9B | $0.7B – $1.1B | -4.3% | ||
| Q1 2027 | $0.9B | $0.7B – $1.1B | -1.9% |
Seasonal Factors
| Fiscal Quarter | Seasonal Factor | vs Trend | Interpretation | Obs. |
|---|---|---|---|---|
| FQ1 (Sep–Nov) | 0.9843 | -1.6% | In line with trend | 9 |
| FQ2 (Dec–Feb) | 0.9914 | -0.9% | In line with trend | 9 |
| FQ3 (Mar–May) | 0.9779 | -2.2% | In line with trend | 8 |
| FQ4 (Jun–Aug) | 1.0569 | +5.7% | +5.7% above trend | 9 |
How Spending Drives Revenue
Want this analysis for your portfolio?
I build custom revenue intelligence reports for investors and companies using SEC filing data, econometric modeling, and AI-powered insights.
Get in Touch