Dover Corporation DOV
Revenue Intelligence Report • 70 quarters of SEC filing data • Updated 2026-03-15
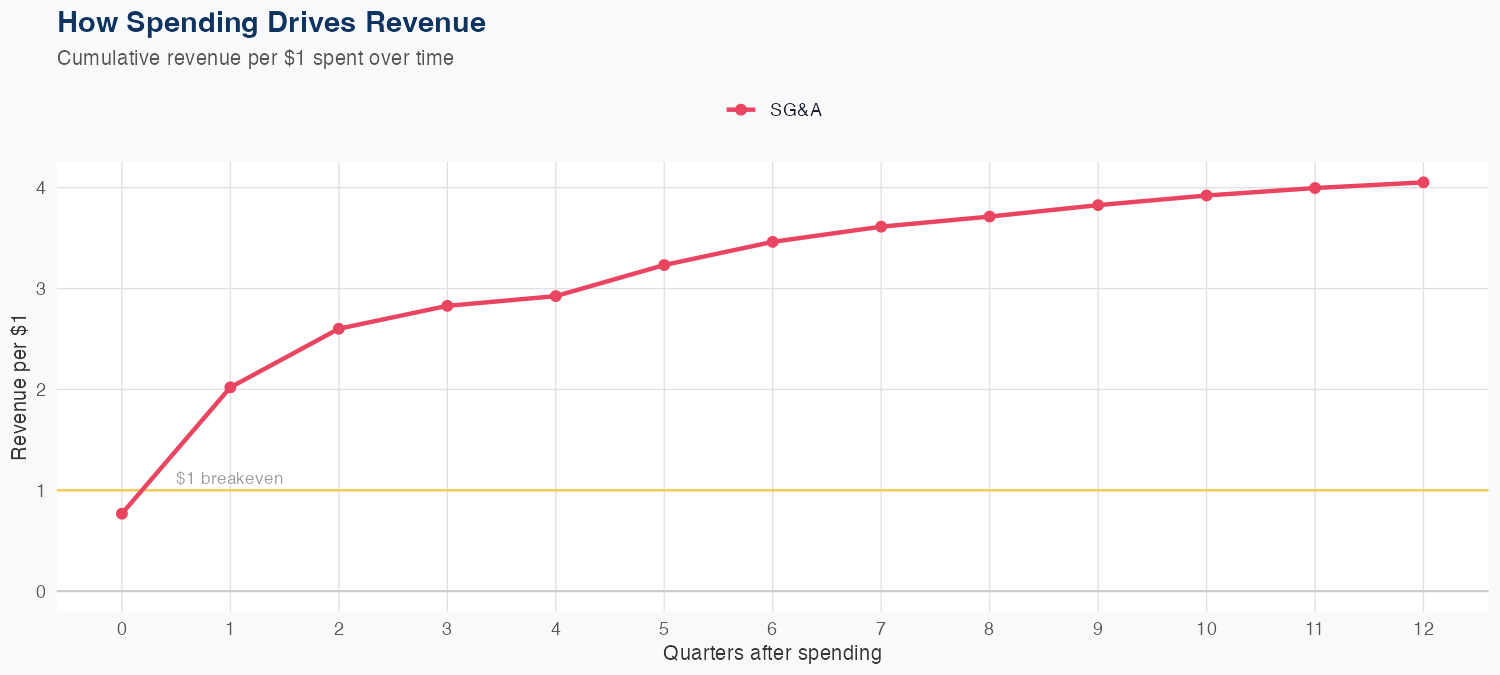
Revenue is driven by efficient SG&A spending, as the model suggests every dollar of SG&A generates about 4.05 dollars of long-run revenue, signaling a strong return on selling, general and administrative investments. The model’s holdout test predicted revenue at 2.1B against actual 2.1B with just 2.3% error, and overall MAPE is 5.3% over 70 quarters, indicating reliable forecasting. The latest quarterly revenue is about 2.099B, with a full-year forecast of 8.5B, representing roughly 5.2% year-over-year growth. Outlook: continued SG&A-driven revenue strength appears to be the key lever, and with no R&D data available, the sustainability of growth hinges on maintaining SG&A ROI amid the ongoing demand environment.
Investment Thesis
The econometric model achieves strong accuracy (5.3% MAPE), suggesting Dover Corporation's revenue trajectory is well-characterized by its spending patterns. Each $1 of SG&A spending generates $4.05 in revenue, reflecting strong commercial efficiency.
Revenue Forecast
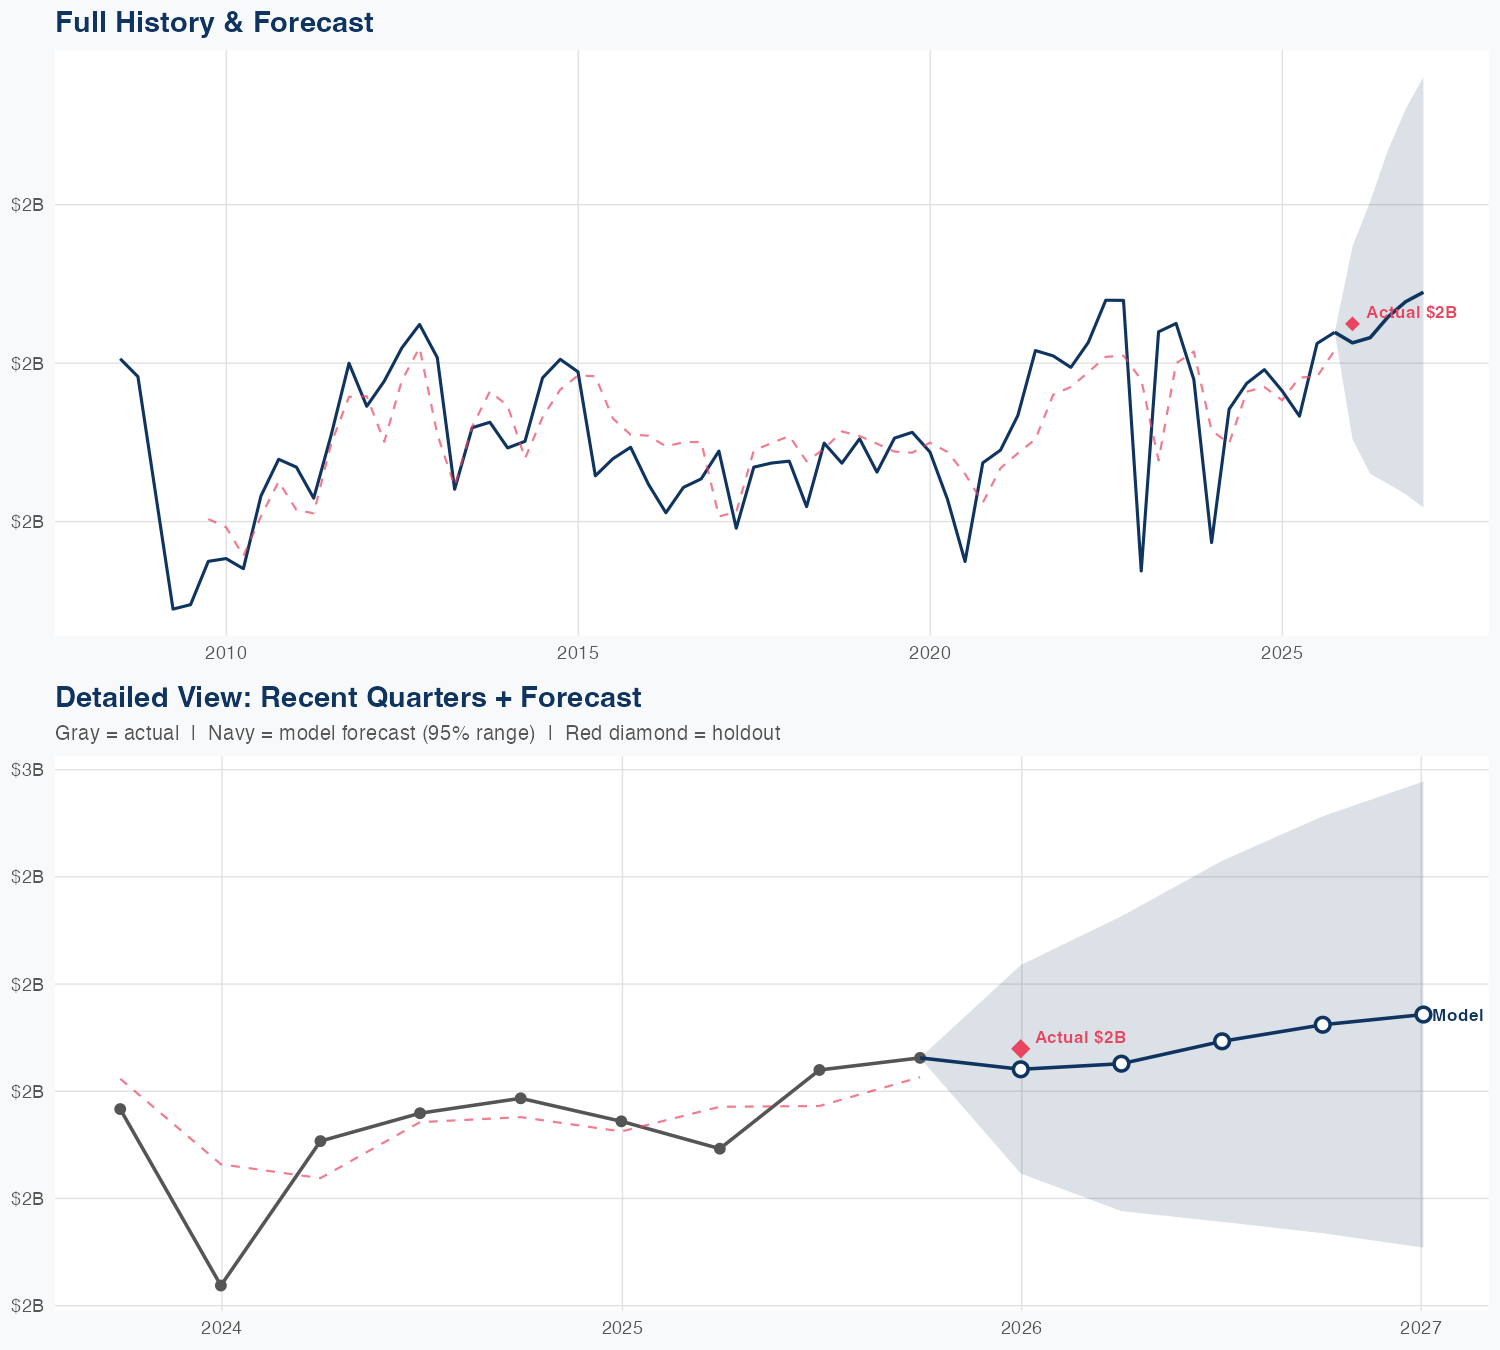
Quarterly Detail
| Quarter | Model Forecast | Actual | 95% Range | YoY Growth | Status |
|---|---|---|---|---|---|
| Q4 2025 | $2.1B | $2.1B | $1.8B – $2.3B | +6.3% | ✓ In range |
| Q2 2026 | $2.1B | $1.7B – $2.4B | +10.6% | ||
| Q3 2026 | $2.1B | $1.7B – $2.5B | +3.3% | ||
| Q4 2026 | $2.2B | $1.7B – $2.6B | +3.7% | ||
| Q1 2027 | $2.2B | $1.6B – $2.7B | +3.8% |
Seasonal Factors
| Fiscal Quarter | Seasonal Factor | vs Trend | Interpretation | Obs. |
|---|---|---|---|---|
| FQ1 (Sep–Nov) | 1.0226 | +2.3% | In line with trend | 17 |
| FQ2 (Dec–Feb) | 0.9961 | -0.4% | In line with trend | 17 |
| FQ3 (Mar–May) | 0.9953 | -0.5% | In line with trend | 16 |
| FQ4 (Jun–Aug) | 1.0192 | +1.9% | In line with trend | 16 |
How Spending Drives Revenue
Want this analysis for your portfolio?
I build custom revenue intelligence reports for investors and companies using SEC filing data, econometric modeling, and AI-powered insights.
Get in Touch