Fastenal Co FAST
Revenue Intelligence Report • 70 quarters of SEC filing data • Updated 2026-03-15
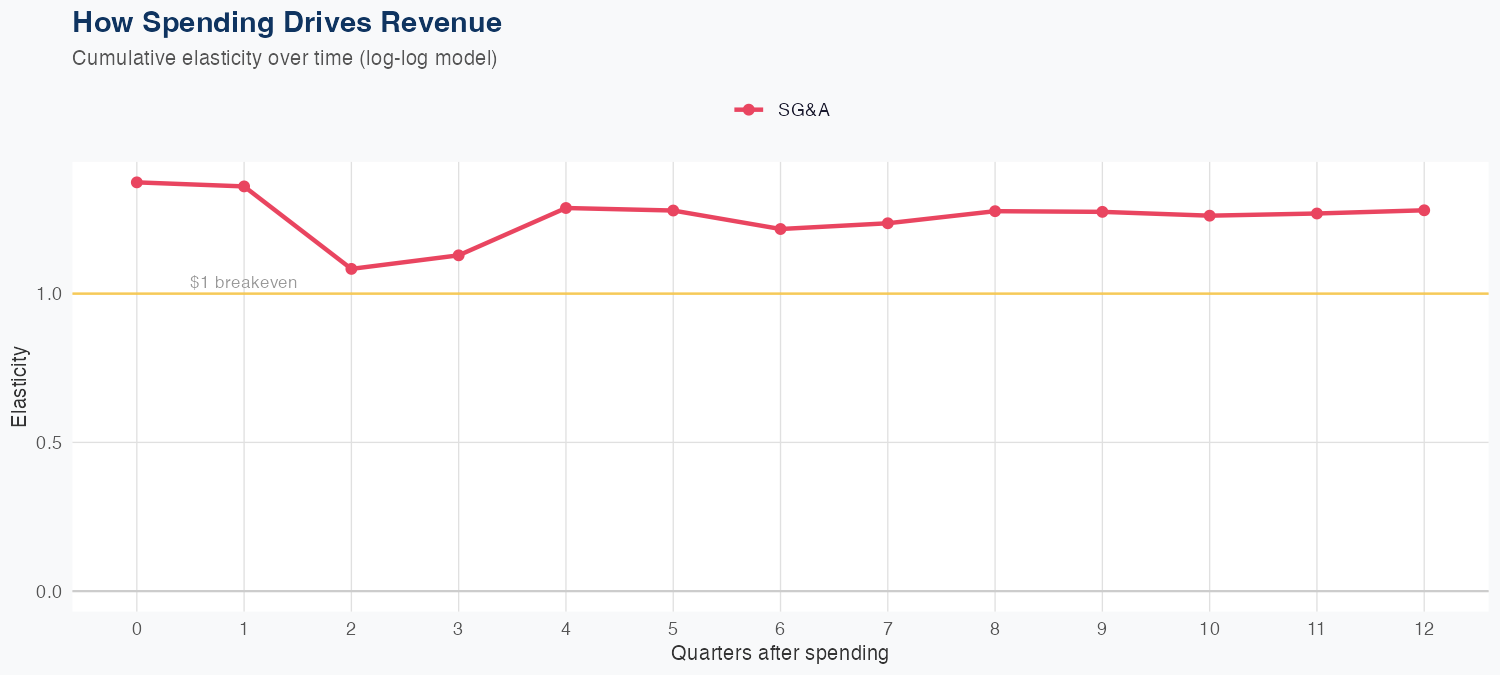
Revenue growth is predominantly driven by SG&A investments, with an elasticity of 1.28% in revenue per 1% SG&A increase, indicating selling and marketing spend can generate outsized top-line gains. The model shows strong predictive accuracy (MAPE 1.8%), with a holdout forecast of 2.1B versus actual 2.0B (–4.2% error), supporting the reliability of these drivers. The outlook remains constructive, with a full-year revenue forecast of 9.1B, up 11.2% year over year. Given the >1x ROI implied by the SG&A elasticity, incremental selling and marketing spend could yield attractive returns, though margins and operating efficiency will be critical to sustaining profitability.
Investment Thesis
Our ARDL model tracks Fastenal Co's revenue with exceptional precision (1.8% MAPE), indicating highly predictable cash flows. Sales & marketing spend shows a 1.28x elasticity, suggesting effective go-to-market execution.
Revenue Forecast
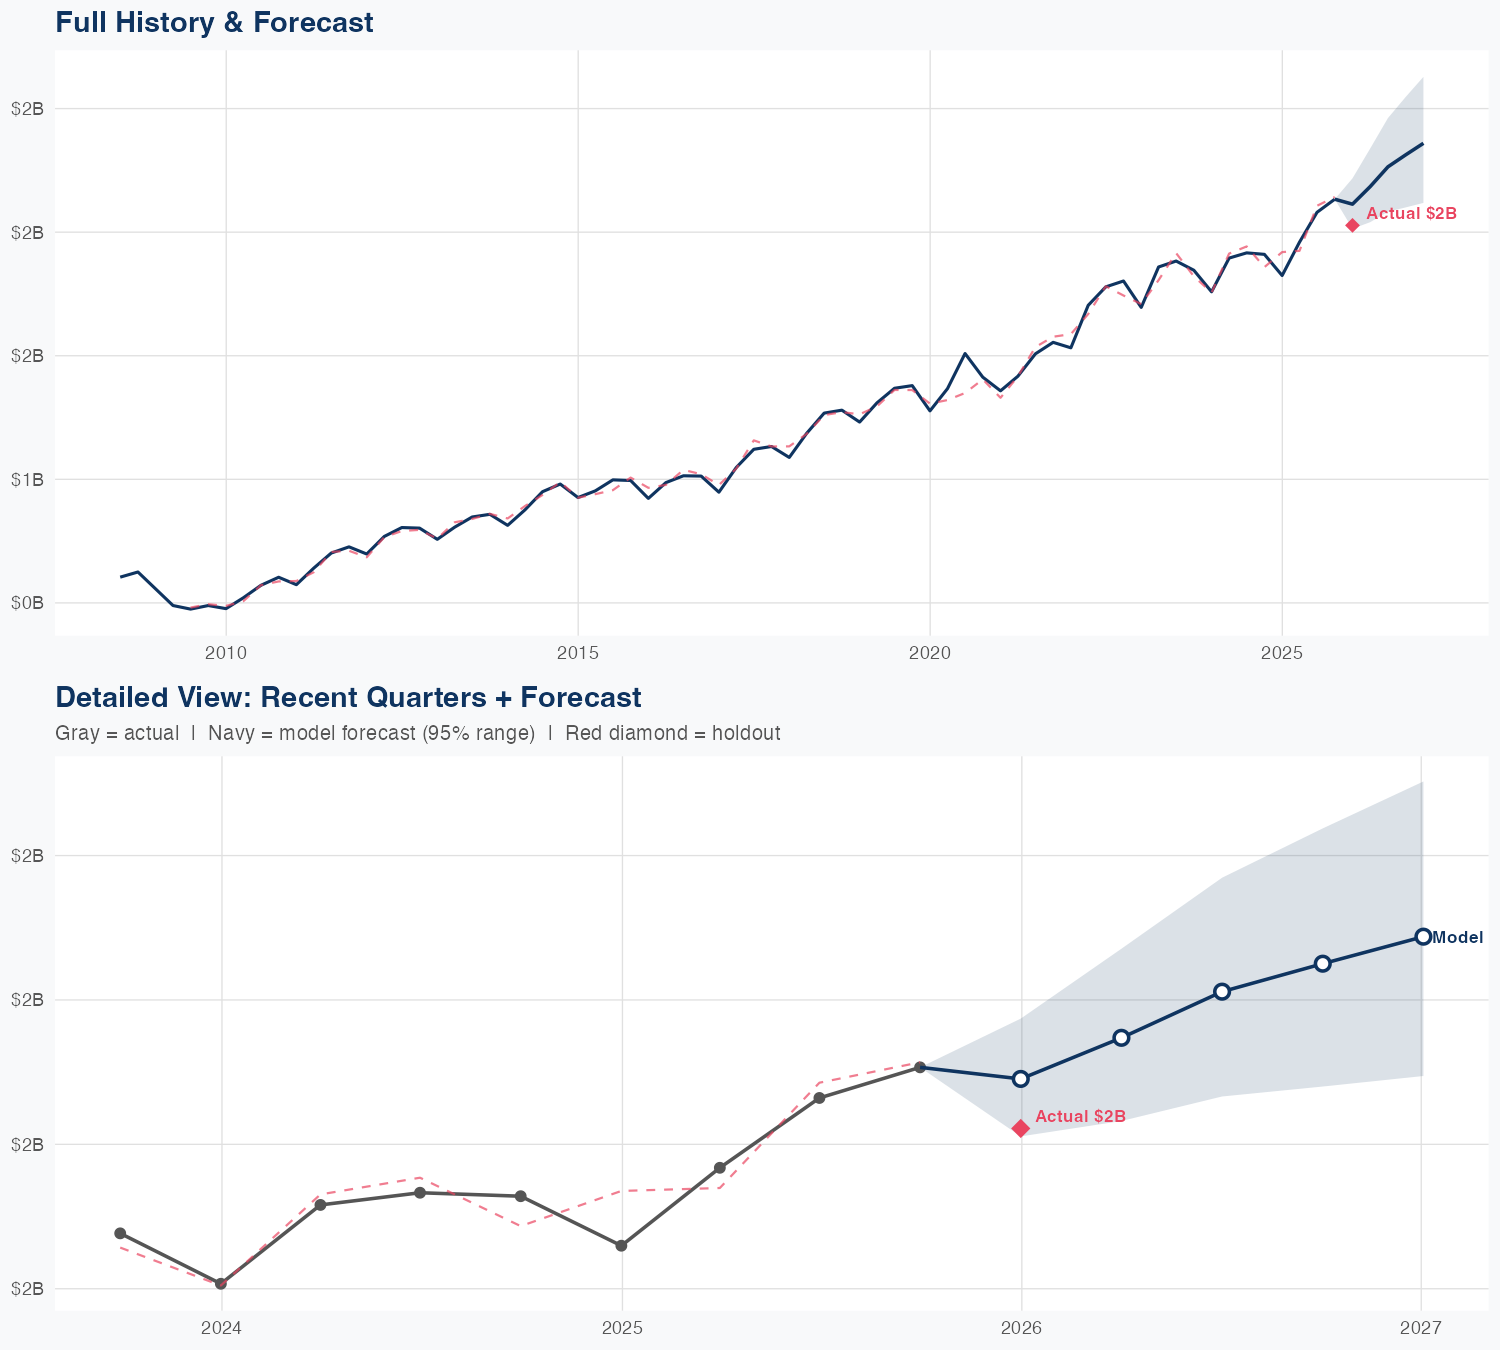
Quarterly Detail
| Quarter | Model Forecast | Actual | 95% Range | YoY Growth | Status |
|---|---|---|---|---|---|
| Q4 2025 | $2.1B | $2.0B | $2.0B – $2.2B | +15.8% | ✓ In range |
| Q2 2026 | $2.2B | $2.0B – $2.3B | +11.5% | ||
| Q3 2026 | $2.3B | $2.1B – $2.5B | +8.8% | ||
| Q4 2026 | $2.3B | $2.1B – $2.5B | +8.4% | ||
| Q1 2027 | $2.4B | $2.1B – $2.6B | +16.4% |
Seasonal Factors
| Fiscal Quarter | Seasonal Factor | vs Trend | Interpretation | Obs. |
|---|---|---|---|---|
| FQ1 (Sep–Nov) | 1.0062 | +0.6% | In line with trend | 17 |
| FQ2 (Dec–Feb) | 0.9769 | -2.3% | In line with trend | 17 |
| FQ3 (Mar–May) | 1.011 | +1.1% | In line with trend | 16 |
| FQ4 (Jun–Aug) | 0.9986 | -0.1% | In line with trend | 17 |
How Spending Drives Revenue
Want this analysis for your portfolio?
I build custom revenue intelligence reports for investors and companies using SEC filing data, econometric modeling, and AI-powered insights.
Get in Touch