Kla Corp KLAC
Revenue Intelligence Report • 50 quarters of SEC filing data • Updated 2026-03-15
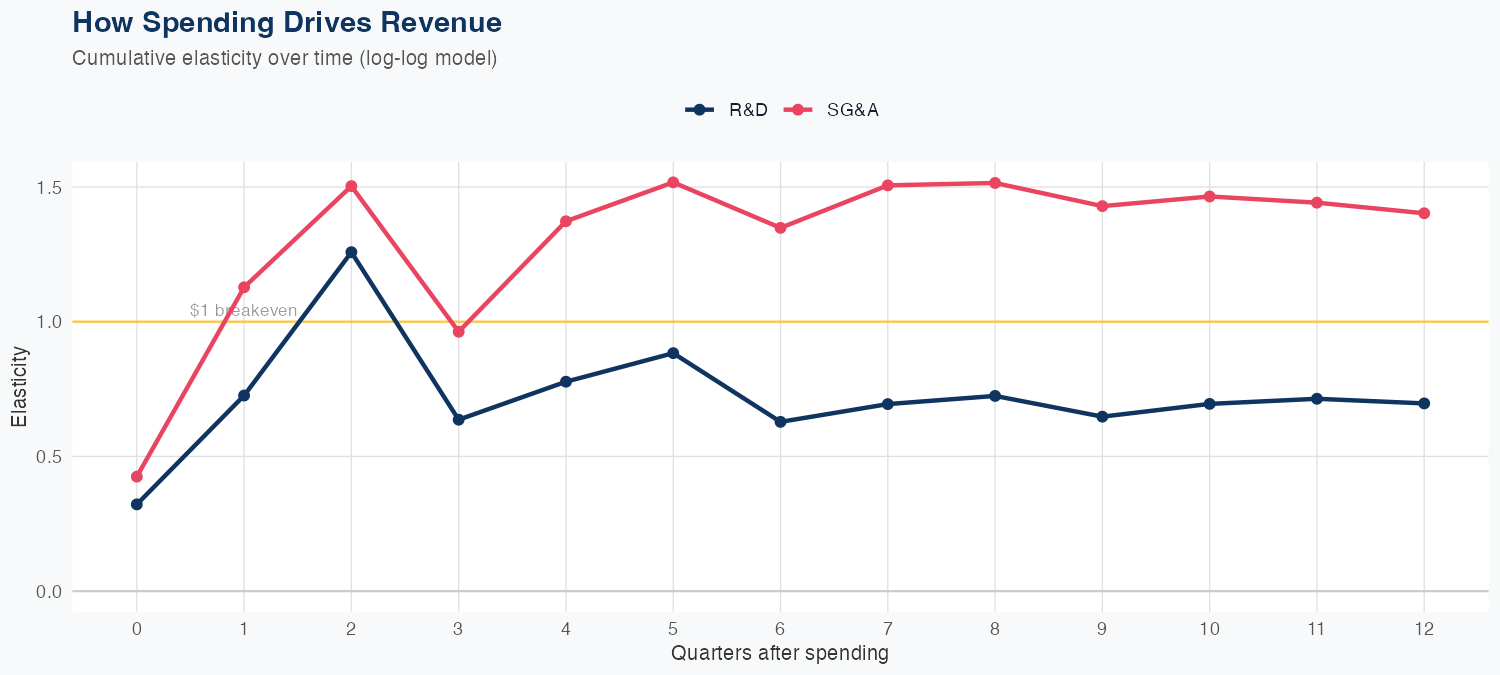
Revenue growth is driven mainly by SG&A investments, which show an elasticity of 1.40 (a 1% SG&A increase corresponds to a 1.40% revenue rise), while R&D contributes 0.70% per 1% spend under the log-log model. The model uses 50 quarters of data and demonstrates reasonable predictive accuracy, with a holdout error of 2.7% (predicted 3.2B vs actual 3.3B) and an overall MAPE of 6.0%. The fiscal-year forecast calls for about $13B in revenue, up 3.0% year over year, signaling solid yet modest top-line growth. For investors, the ROI of SG&A spend appears stronger than R&D within the model, but outcomes remain sensitive to execution and market conditions; disciplined spending will be key to sustaining the forecast.
Investment Thesis
The econometric model achieves strong accuracy (6.0% MAPE), suggesting Kla Corp's revenue trajectory is well-characterized by its spending patterns. R&D investment shows a 0.70x multiplier — each 1% increase in R&D spend is associated with a 0.70% revenue increase, signaling strong innovation-to-revenue conversion. Sales & marketing spend shows a 1.40x elasticity, suggesting effective go-to-market execution.
Revenue Forecast
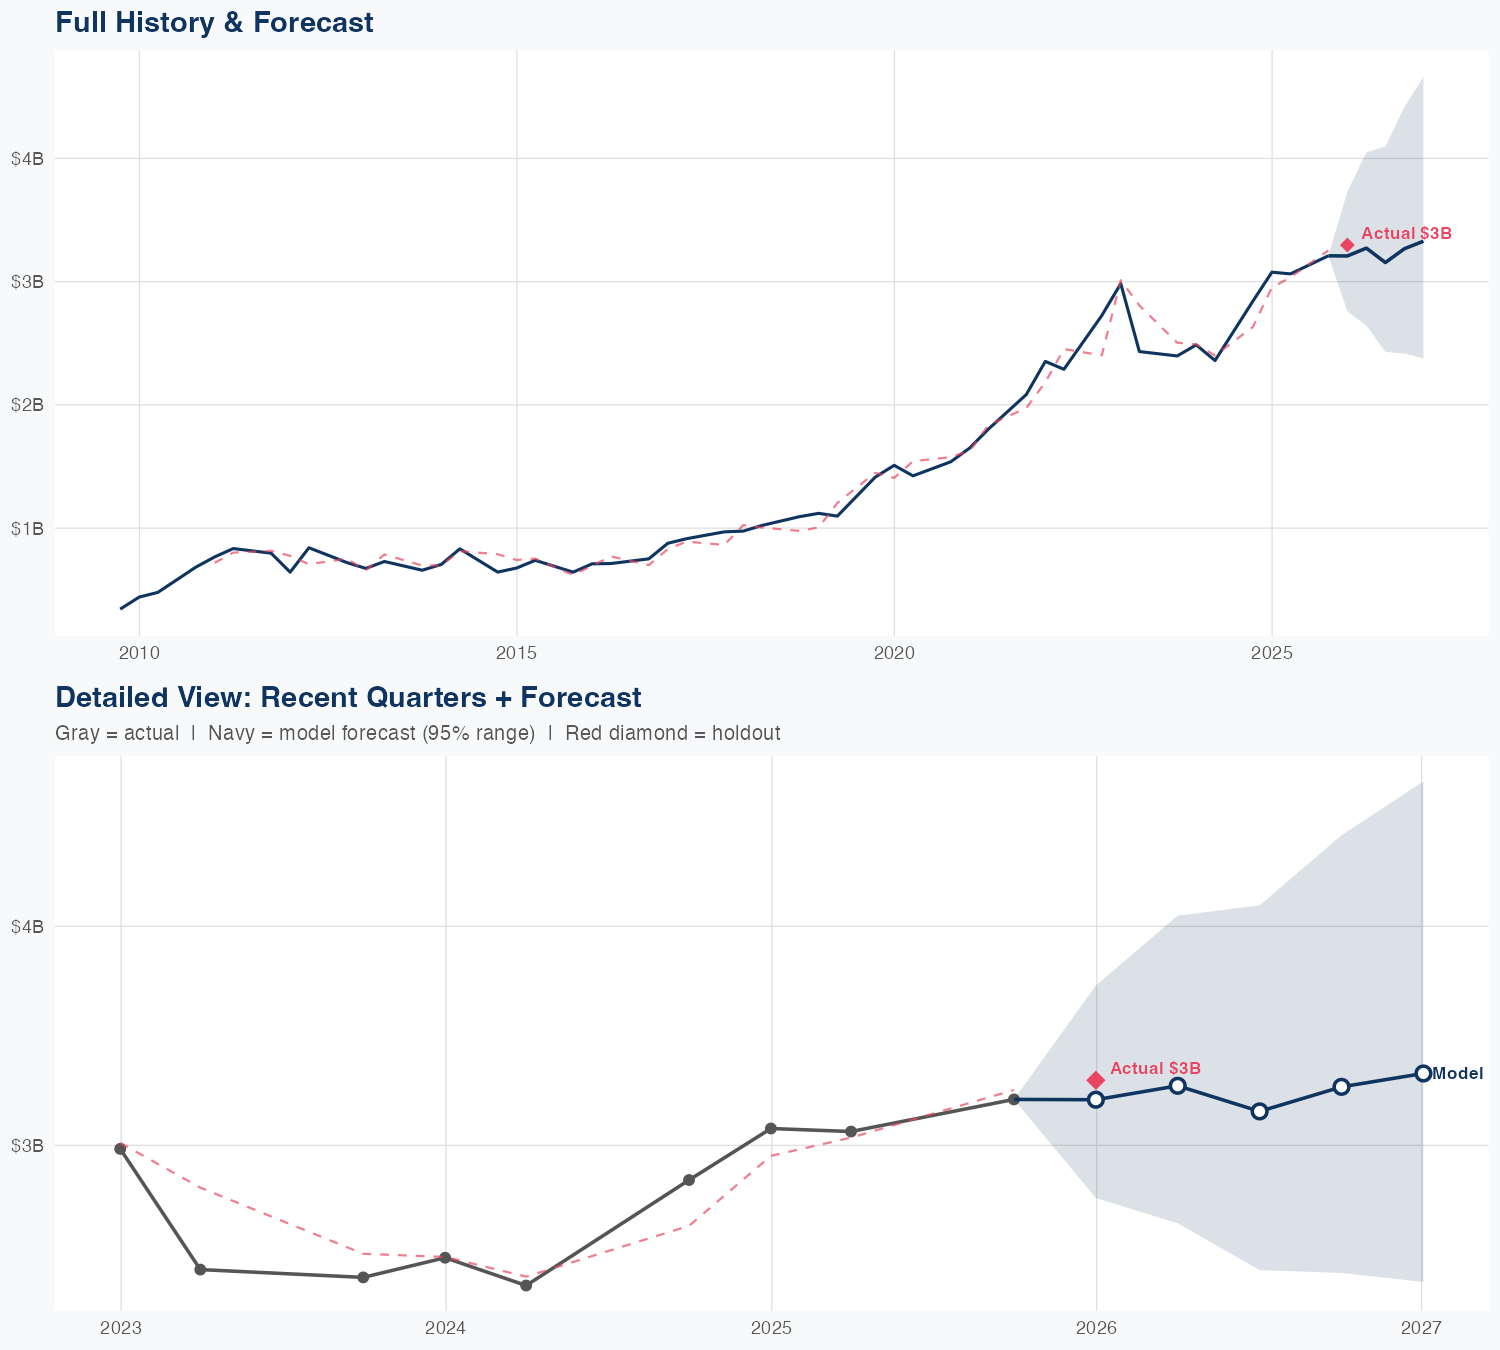
Quarterly Detail
| Quarter | Model Forecast | Actual | 95% Range | YoY Growth | Status |
|---|---|---|---|---|---|
| Q4 2025 | $3.2B | $3.3B | $2.8B – $3.7B | +12.9% | ✓ In range |
| Q2 2026 | $3.3B | $2.6B – $4.0B | +6.3% | ||
| Q3 2026 | $3.2B | $2.4B – $4.1B | +3.0% | ||
| Q4 2026 | $3.3B | $2.4B – $4.4B | +1.8% | ||
| Q1 2027 | $3.3B | $2.4B – $4.7B | +0.9% |
Seasonal Factors
| Fiscal Quarter | Seasonal Factor | vs Trend | Interpretation | Obs. |
|---|---|---|---|---|
| FQ1 (Sep–Nov) | 0.9868 | -1.3% | In line with trend | 15 |
| FQ2 (Dec–Feb) | 1.0218 | +2.2% | In line with trend | 16 |
| FQ3 (Mar–May) | 0.9821 | -1.8% | In line with trend | 15 |
| FQ4 (Jun–Aug) | 1.0 | +0.0% | In line with trend | 0 |
How Spending Drives Revenue
Want this analysis for your portfolio?
I build custom revenue intelligence reports for investors and companies using SEC filing data, econometric modeling, and AI-powered insights.
Get in Touch