Lam Research Corporation LRCX
Revenue Intelligence Report • 50 quarters of SEC filing data • Updated 2026-03-15
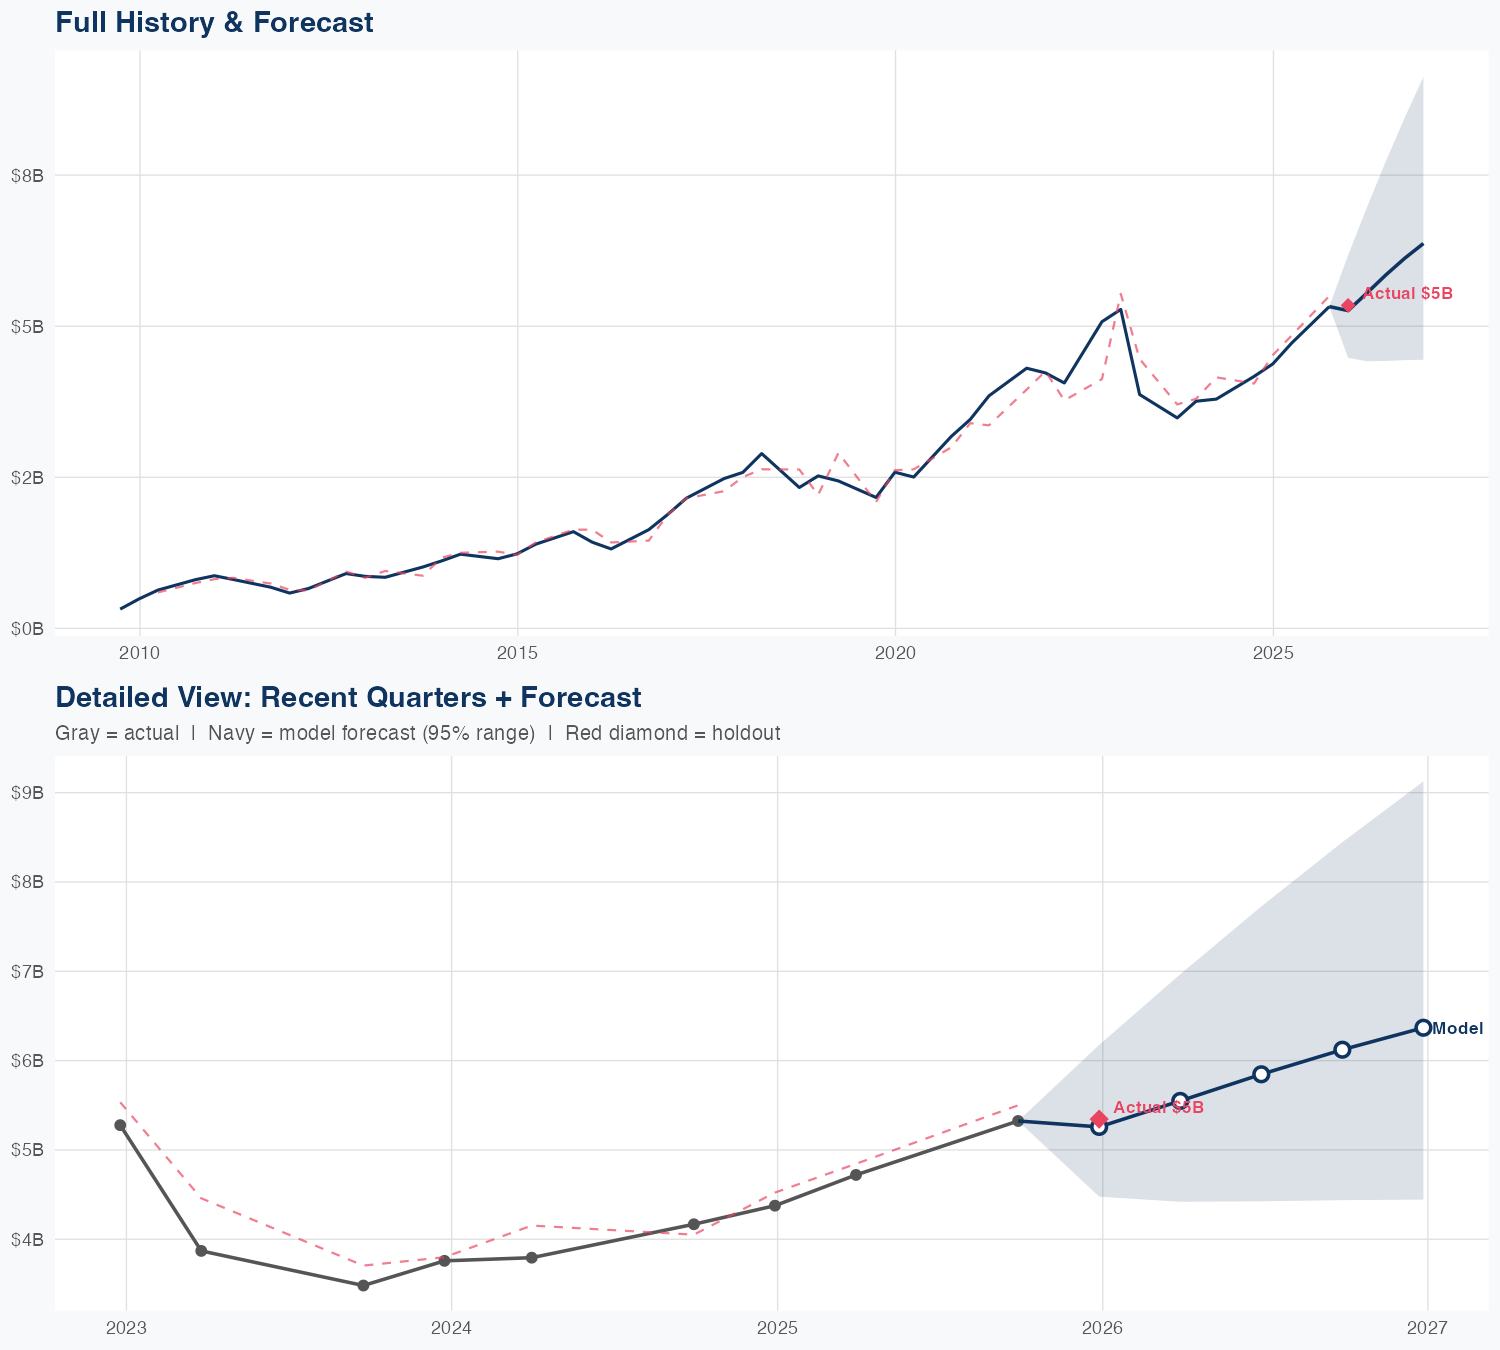
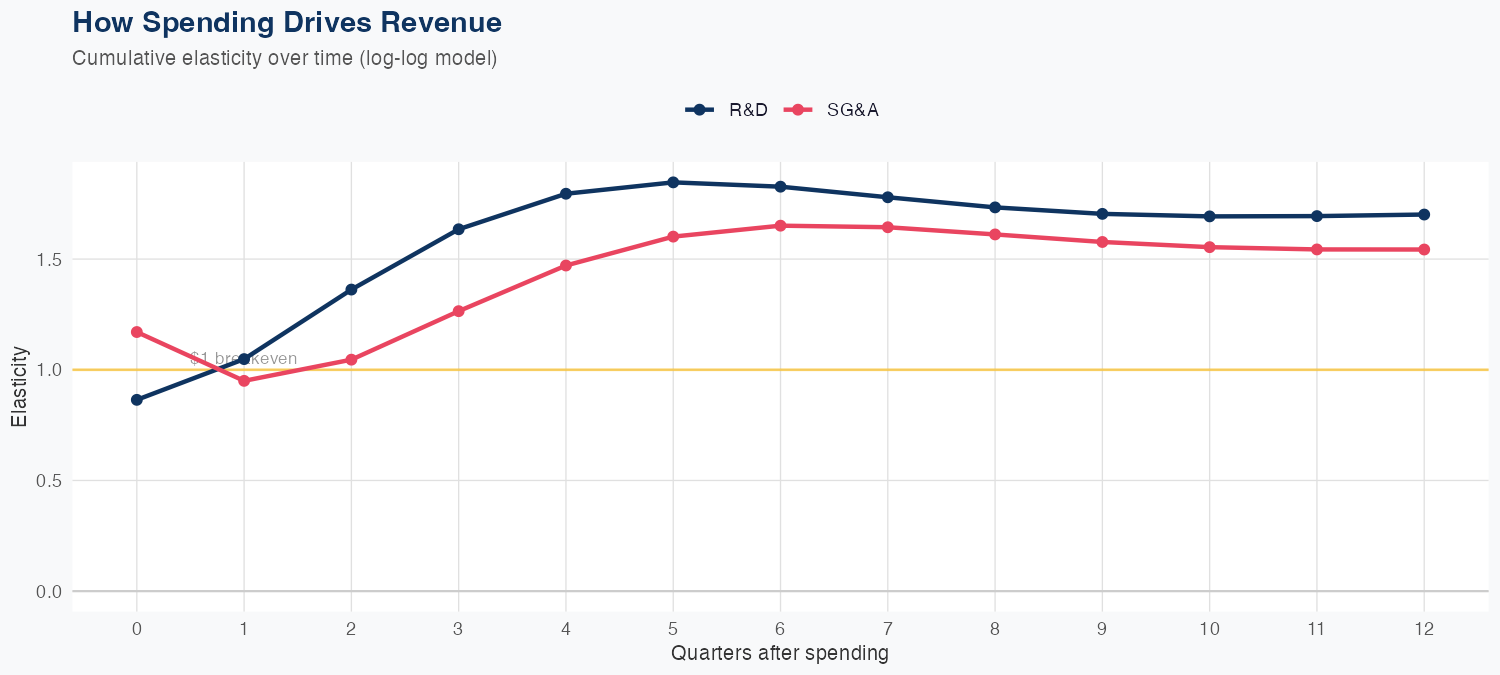
Revenue growth is driven by positive, relatively high elasticities to R&D and SG&A investments, with 1% more R&D boosting revenue by 1.70% and 1% more SG&A boosting revenue by 1.54%, making R&D the more potent driver of topline growth. The log-log model achieves a 6.6% MAPE and held out with a predicted $5.3B versus actual $5.3B, translating to about 1.6% error, indicating credible near-term forecasting performance. With a quarterly revenue of about $5.35B, the FY revenue forecast is $24B, representing a 20.8% year-over-year increase, underpinned by the ongoing revenue responsiveness to spend in R&D and SG&A. The ROI implication is that R&D investment drives stronger revenue uplift than SG&A, supporting a constructive growth outlook while margin outcomes will hinge on the efficiency of SG&A spending and the cost structure as demand evolves.
Investment Thesis
The econometric model achieves strong accuracy (6.6% MAPE), suggesting Lam Research Corporation's revenue trajectory is well-characterized by its spending patterns. R&D investment shows a 1.70x multiplier — each 1% increase in R&D spend is associated with a 1.70% revenue increase, signaling strong innovation-to-revenue conversion. Sales & marketing spend shows a 1.54x elasticity, suggesting effective go-to-market execution.
Revenue Forecast
Quarterly Detail
| Quarter | Model Forecast | Actual | 95% Range | YoY Growth | Status |
|---|---|---|---|---|---|
| Q4 2025 | $5.3B | $5.3B | $4.5B – $6.2B | +26.1% | ✓ In range |
| Q1 2026 | $5.5B | $4.4B – $7.0B | +26.8% | ||
| Q2 2026 | $5.8B | $4.4B – $7.7B | +23.9% | ||
| Q3 2026 | $6.1B | $4.4B – $8.4B | +15.0% | ||
| Q4 2026 | $6.4B | $4.4B – $9.1B | +19.1% |
Seasonal Factors
| Fiscal Quarter | Seasonal Factor | vs Trend | Interpretation | Obs. |
|---|---|---|---|---|
| FQ1 (Sep–Nov) | 1.0351 | +3.5% | +3.5% above trend | 16 |
| FQ2 (Dec–Feb) | 1.0017 | +0.2% | In line with trend | 16 |
| FQ3 (Mar–May) | 0.9803 | -2.0% | In line with trend | 16 |
| FQ4 (Jun–Aug) | 1.0 | +0.0% | In line with trend | 0 |
How Spending Drives Revenue
Want this analysis for your portfolio?
I build custom revenue intelligence reports for investors and companies using SEC filing data, econometric modeling, and AI-powered insights.
Get in Touch