Microchip Technology Incorporated MCHP
Revenue Intelligence Report • 54 quarters of SEC filing data • Updated 2026-03-15
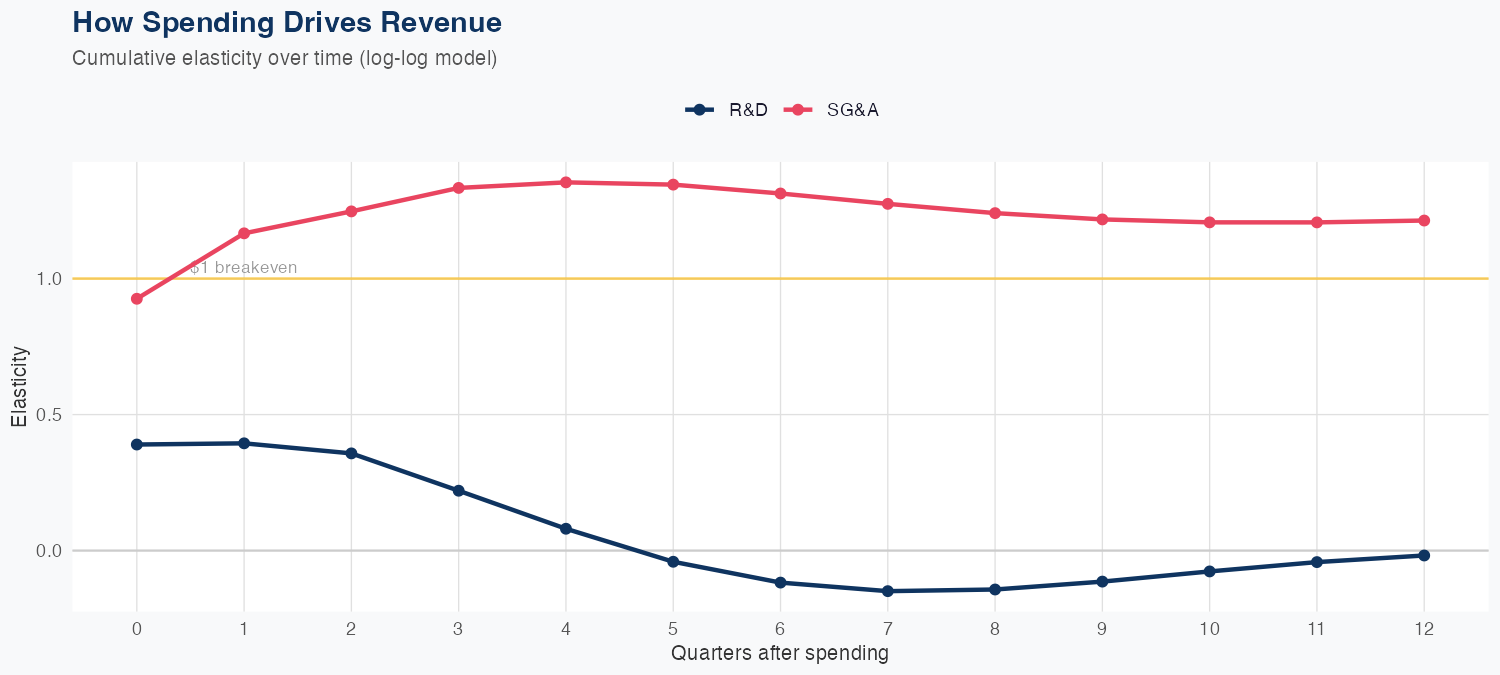
Revenue is driven primarily by SG&A spending, with a 1% increase in SG&A linked to a 1.21% rise in revenue, while a 1% increase in R&D shows a slight negative revenue impact (-0.02%), per the log-log model. The model uses 54 quarters of data and achieves 4.6% MAPE, with a holdout test error around 3.5% (predicted $1.1B vs actual $1.2B), indicating reasonable forecasting accuracy. The FY outlook projects about $4.8B in revenue, up 7.7% year over year. Investors should note that SG&A efficiency appears to be the main revenue lever, with R&D having limited or negative impact in this framework; sustaining growth will rely on optimizing SG&A ROI and carefully evaluating the productivity of R&D investments.
Investment Thesis
The econometric model achieves strong accuracy (4.6% MAPE), suggesting Microchip Technology Incorporated's revenue trajectory is well-characterized by its spending patterns. R&D spending currently shows a negative elasticity (-0.02x), which can indicate heavy investment in long-cycle initiatives not yet reflected in revenue. Sales & marketing spend shows a 1.21x elasticity, suggesting effective go-to-market execution.
Revenue Forecast
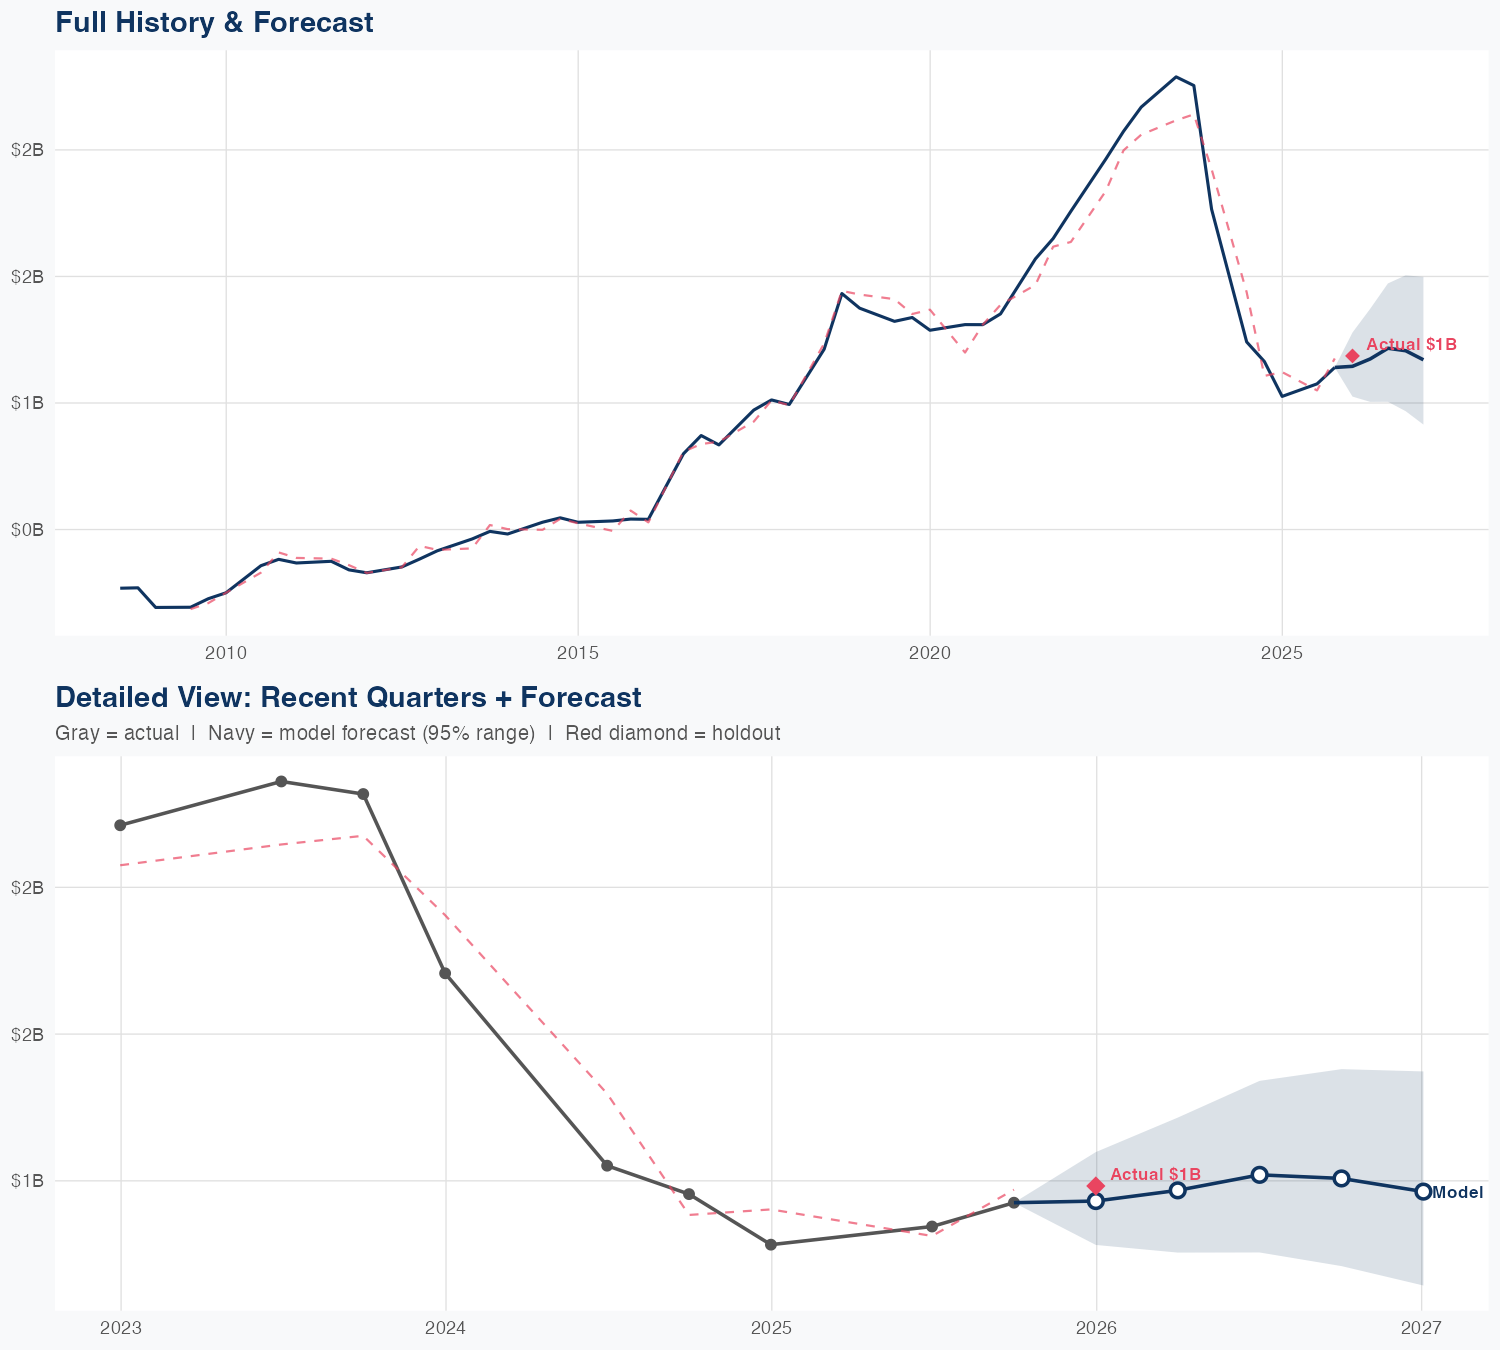
Quarterly Detail
| Quarter | Model Forecast | Actual | 95% Range | YoY Growth | Status |
|---|---|---|---|---|---|
| Q4 2025 | $1.1B | $1.2B | $1.0B – $1.3B | -1.6% | ✓ In range |
| Q2 2026 | $1.2B | $1.0B – $1.4B | +14.4% | ||
| Q3 2026 | $1.2B | $1.0B – $1.5B | +13.1% | ||
| Q4 2026 | $1.2B | $1.0B – $1.5B | +5.8% | ||
| Q1 2027 | $1.2B | $0.9B – $1.5B | -1.3% |
Seasonal Factors
| Fiscal Quarter | Seasonal Factor | vs Trend | Interpretation | Obs. |
|---|---|---|---|---|
| FQ1 (Sep–Nov) | 1.0001 | +0.0% | In line with trend | 17 |
| FQ2 (Dec–Feb) | 0.9852 | -1.5% | In line with trend | 17 |
| FQ3 (Mar–May) | 1.0 | +0.0% | In line with trend | 0 |
| FQ4 (Jun–Aug) | 1.0491 | +4.9% | +4.9% above trend | 17 |
How Spending Drives Revenue
Want this analysis for your portfolio?
I build custom revenue intelligence reports for investors and companies using SEC filing data, econometric modeling, and AI-powered insights.
Get in Touch