Microsoft Corporation MSFT
Revenue Intelligence Report • 53 quarters of SEC filing data • Updated 2026-03-15
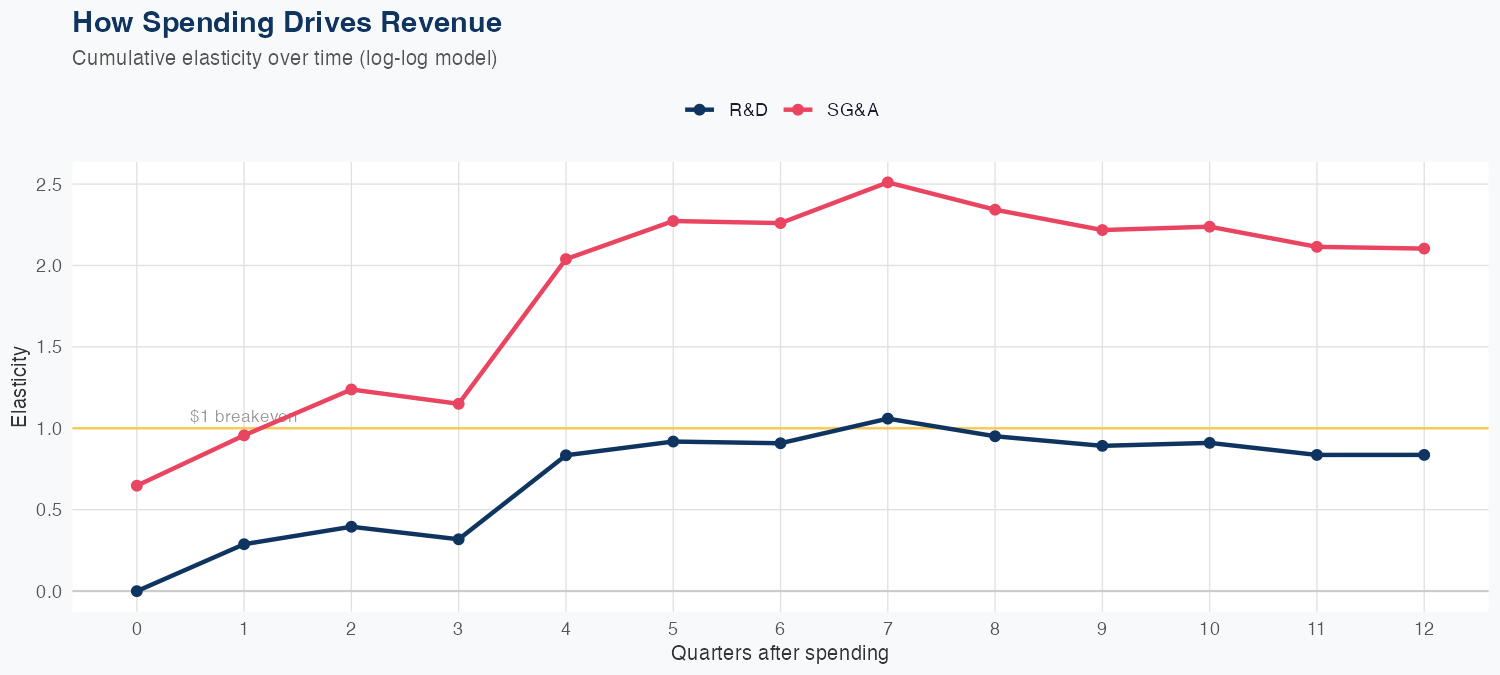
Microsoft’s 8.1% revenue lift to $323B masks a growth mix where SG&A plays the bigger lever. Our econometric model assigns R&D elasticity at 0.84x (roughly 0.8% more revenue per 1% higher R&D spend) and SG&A elasticity at 2.10x (about 2.1% revenue per 1% SG&A spend), implying near-term growth is driven more by scale in go-to-market, cloud sales, and cross-portfolio selling than by product-cycle advances alone. The holdout miss—predicted $76.6B vs actual $81.3B (−5.7% error)—suggests the model underestimates some near-term demand drivers, though a 3.2% overall MAPE across 53 quarters indicates reasonable reliability. Risks to this growth structure include potential margin compression from high SG&A spend, intensified cloud competition (Azure, AWS, Google Cloud), and any slower enterprise IT spending or AI-oversaturation concerns that could curb the revenue lift from scale.
Investment Thesis
The econometric model achieves strong accuracy (3.2% MAPE), suggesting Microsoft Corporation's revenue trajectory is well-characterized by its spending patterns. R&D investment shows a 0.84x multiplier — each 1% increase in R&D spend is associated with a 0.84% revenue increase, signaling strong innovation-to-revenue conversion. Sales & marketing spend shows a 2.10x elasticity, suggesting effective go-to-market execution.
Revenue Forecast
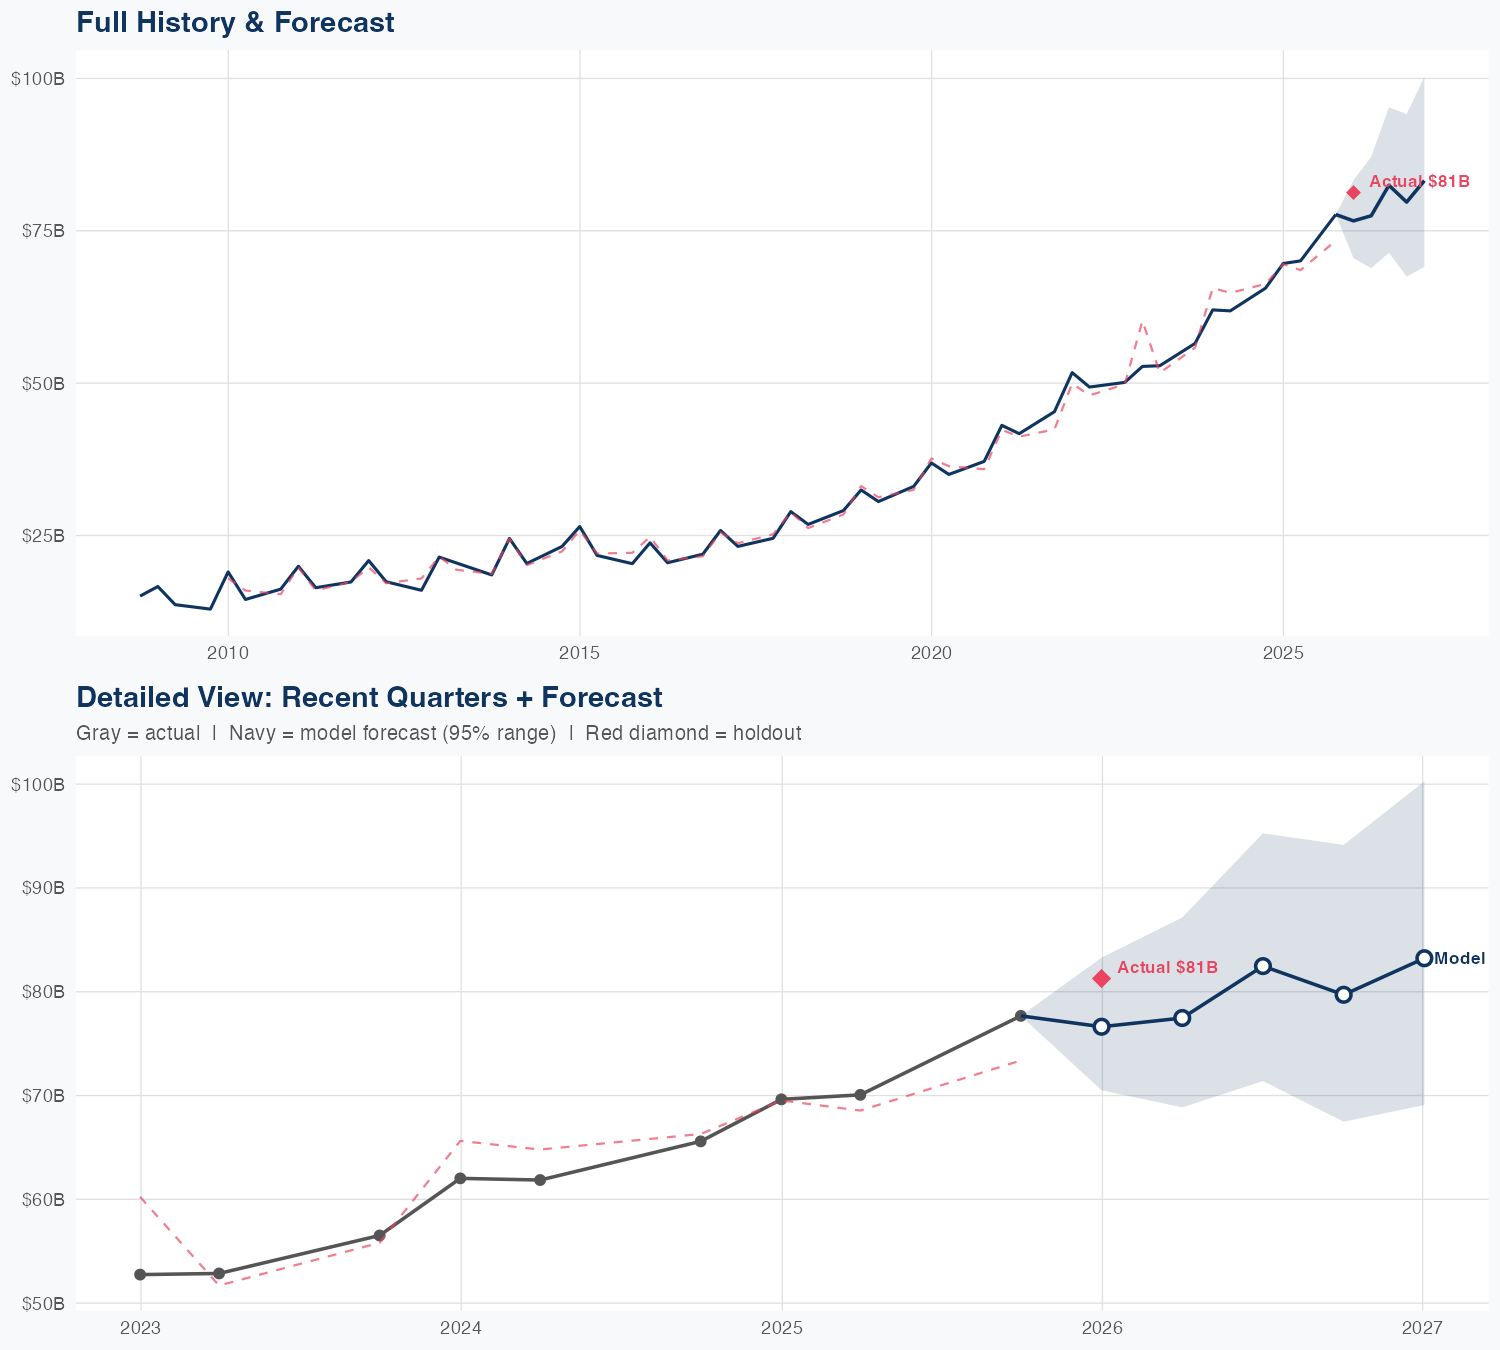
Quarterly Detail
| Quarter | Model Forecast | Actual | 95% Range | YoY Growth | Status |
|---|---|---|---|---|---|
| Q4 2025 | $77B | $81B | $71B – $83B | +16.8% | ✓ In range |
| Q2 2026 | $77B | $69B – $87B | +11.3% | ||
| Q3 2026 | $82B | $71B – $95B | +17.7% | ||
| Q4 2026 | $80B | $67B – $94B | +2.6% | ||
| Q1 2027 | $83B | $69B – $100B | +2.4% |
Latest Earnings Call
Q2 2026Seasonal Factors
| Fiscal Quarter | Seasonal Factor | vs Trend | Interpretation | Obs. |
|---|---|---|---|---|
| FQ1 (Sep–Nov) | 1.0154 | +1.5% | In line with trend | 16 |
| FQ2 (Dec–Feb) | 1.0026 | +0.3% | In line with trend | 17 |
| FQ3 (Mar–May) | 1.0134 | +1.3% | In line with trend | 16 |
| FQ4 (Jun–Aug) | 1.0 | +0.0% | In line with trend | 0 |
How Spending Drives Revenue
Want this analysis for your portfolio?
I build custom revenue intelligence reports for investors and companies using SEC filing data, econometric modeling, and AI-powered insights.
Get in Touch