Netapp, Inc. NTAP
Revenue Intelligence Report • 51 quarters of SEC filing data • Updated 2026-03-15
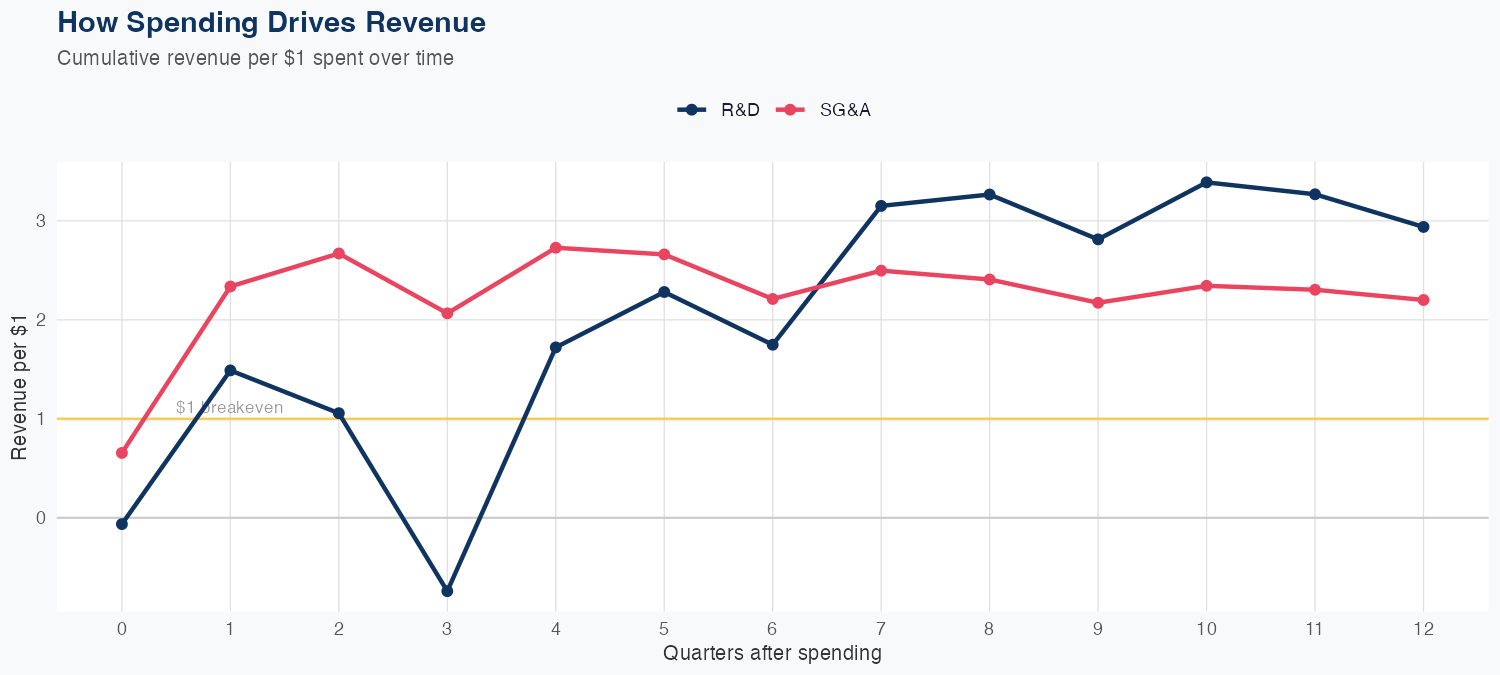
Revenue is driven by demand for data storage and management solutions, with ROI from spending indicating $1 of R&D yields $2.89 of long-run revenue and $1 of SG&A yields $2.18. The latest quarterly revenue was $1.713 billion, supported by 51 quarters of data and a linear model with 3.1% MAPE. Holdout testing shows the model predicted $1.7B versus actual $1.7B, a 2.1% error, indicating solid forecast reliability. The FY revenue forecast is $6.5B, down 1.4% year over year, signaling a modest near-term outlook despite strong ROI on R&D and SG&A investments.
Investment Thesis
The econometric model achieves strong accuracy (3.1% MAPE), suggesting Netapp, Inc.'s revenue trajectory is well-characterized by its spending patterns. Every $1 of R&D investment is associated with $2.89 of revenue, indicating efficient capital deployment in innovation. Each $1 of SG&A spending generates $2.18 in revenue, reflecting strong commercial efficiency.
Revenue Forecast
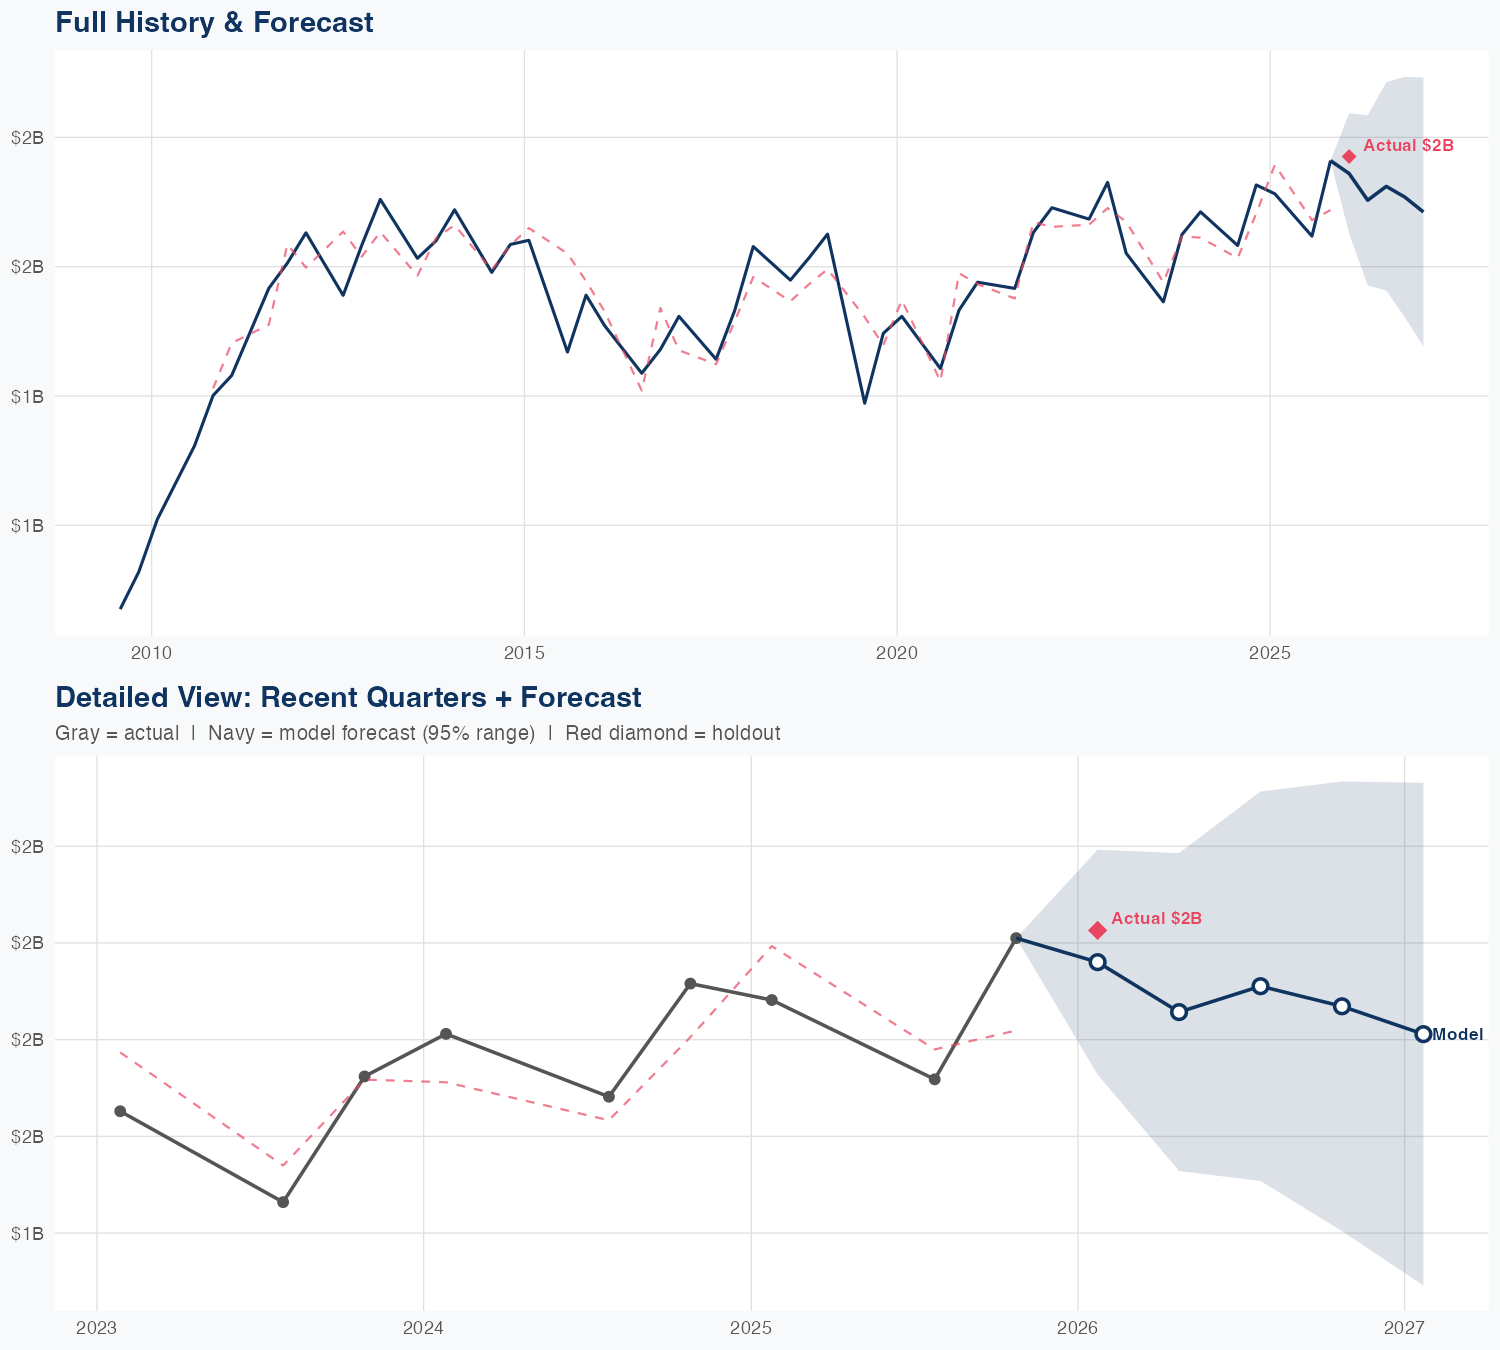
Quarterly Detail
| Quarter | Model Forecast | Actual | 95% Range | YoY Growth | Status |
|---|---|---|---|---|---|
| Q1 2026 | $1.7B | $1.7B | $1.6B – $1.8B | +1.2% | ✓ In range |
| Q2 2026 | $1.6B | $1.5B – $1.8B | -0.7% | ||
| Q3 2026 | $1.7B | $1.5B – $1.9B | +6.1% | ||
| Q4 2026 | $1.6B | $1.4B – $1.9B | -4.2% | ||
| Q1 2027 | $1.6B | $1.3B – $1.9B | -6.1% |
Seasonal Factors
| Fiscal Quarter | Seasonal Factor | vs Trend | Interpretation | Obs. |
|---|---|---|---|---|
| FQ1 (Sep–Nov) | 1.0014 | +0.1% | In line with trend | 16 |
| FQ2 (Dec–Feb) | 1.0238 | +2.4% | In line with trend | 16 |
| FQ3 (Mar–May) | 1.0 | +0.0% | In line with trend | 0 |
| FQ4 (Jun–Aug) | 1.0096 | +1.0% | In line with trend | 15 |
How Spending Drives Revenue
Want this analysis for your portfolio?
I build custom revenue intelligence reports for investors and companies using SEC filing data, econometric modeling, and AI-powered insights.
Get in Touch