Packaging Corp of America PKG
Revenue Intelligence Report • 66 quarters of SEC filing data • Updated 2026-03-15
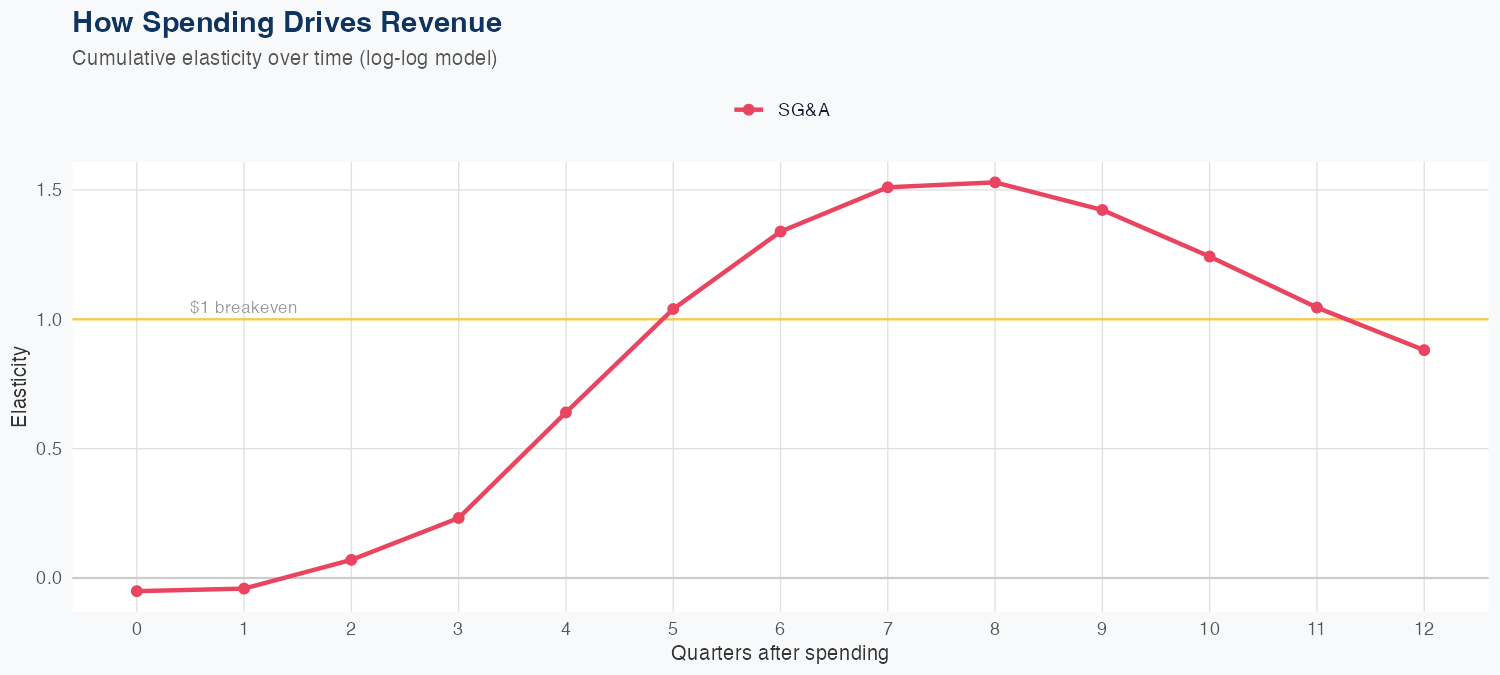
Revenue is largely driven by SG&A spending, with a log-log elasticity of 0.88: a 1% uptick in SG&A is associated with roughly a 0.88% rise in revenue, as seen in the latest quarter's $2.364 billion in revenue. The forecasting model shows solid predictive accuracy, with a 3.1% MAPE and a holdout test error of 4.2%, where a $2.3B forecast was close to the actual $2.4B. The FY outlook calls for $8.5B in revenue, about 5.4% lower year over year, signaling near-term headwinds. Investors should view SG&A spending as a positive ROI lever for revenue, but sustaining growth will require disciplined cost management and favorable demand to offset the negative growth trajectory.
Investment Thesis
The econometric model achieves strong accuracy (3.1% MAPE), suggesting Packaging Corp of America's revenue trajectory is well-characterized by its spending patterns. Sales & marketing spend shows a 0.88x elasticity, suggesting effective go-to-market execution.
Revenue Forecast
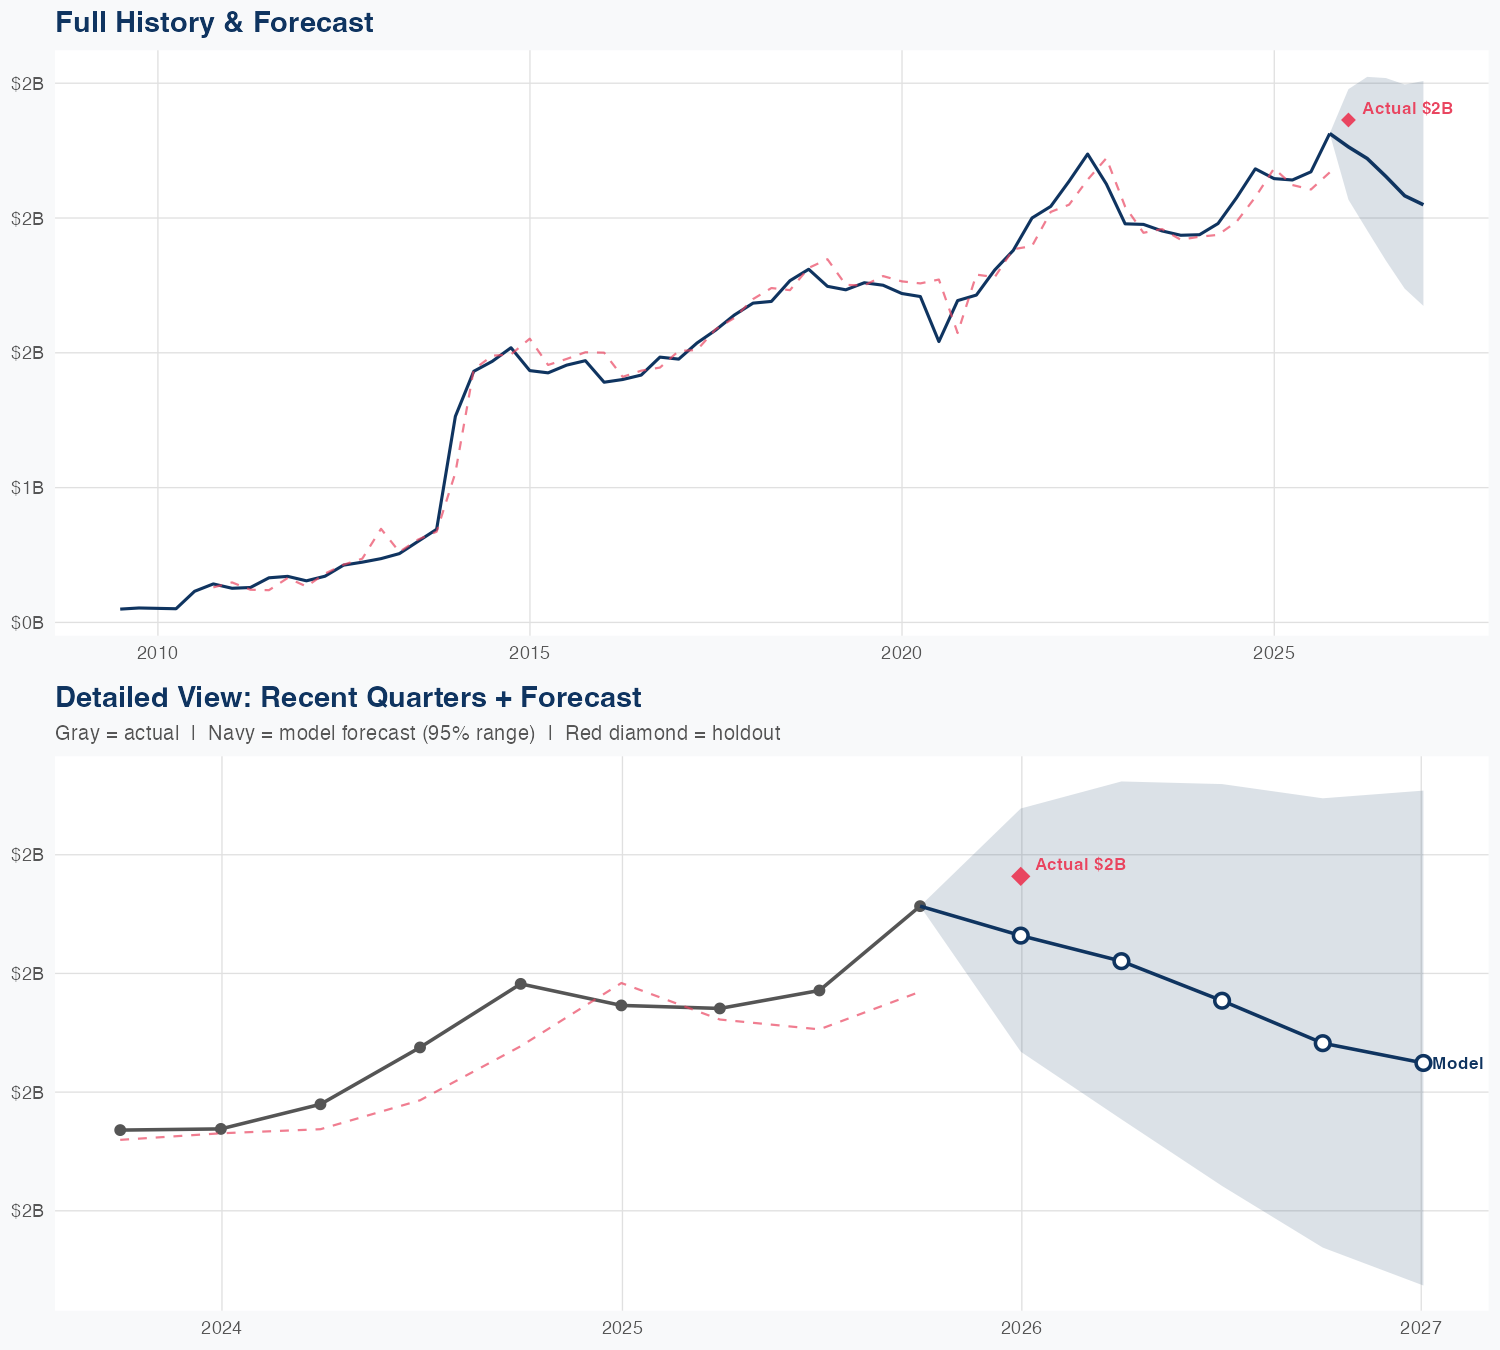
Quarterly Detail
| Quarter | Model Forecast | Actual | 95% Range | YoY Growth | Status |
|---|---|---|---|---|---|
| Q4 2025 | $2.3B | $2.4B | $2.1B – $2.5B | +5.5% | ✓ In range |
| Q2 2026 | $2.2B | $2.0B – $2.5B | +3.7% | ||
| Q3 2026 | $2.2B | $1.8B – $2.5B | -0.8% | ||
| Q4 2026 | $2.1B | $1.7B – $2.5B | -10.0% | ||
| Q1 2027 | $2.0B | $1.7B – $2.5B | -13.3% |
Seasonal Factors
| Fiscal Quarter | Seasonal Factor | vs Trend | Interpretation | Obs. |
|---|---|---|---|---|
| FQ1 (Sep–Nov) | 1.0106 | +1.1% | In line with trend | 16 |
| FQ2 (Dec–Feb) | 0.98 | -2.0% | In line with trend | 16 |
| FQ3 (Mar–May) | 0.9954 | -0.5% | In line with trend | 15 |
| FQ4 (Jun–Aug) | 0.9977 | -0.2% | In line with trend | 15 |
How Spending Drives Revenue
Want this analysis for your portfolio?
I build custom revenue intelligence reports for investors and companies using SEC filing data, econometric modeling, and AI-powered insights.
Get in Touch