Pool Corporation POOL
Revenue Intelligence Report • 66 quarters of SEC filing data • Updated 2026-03-15
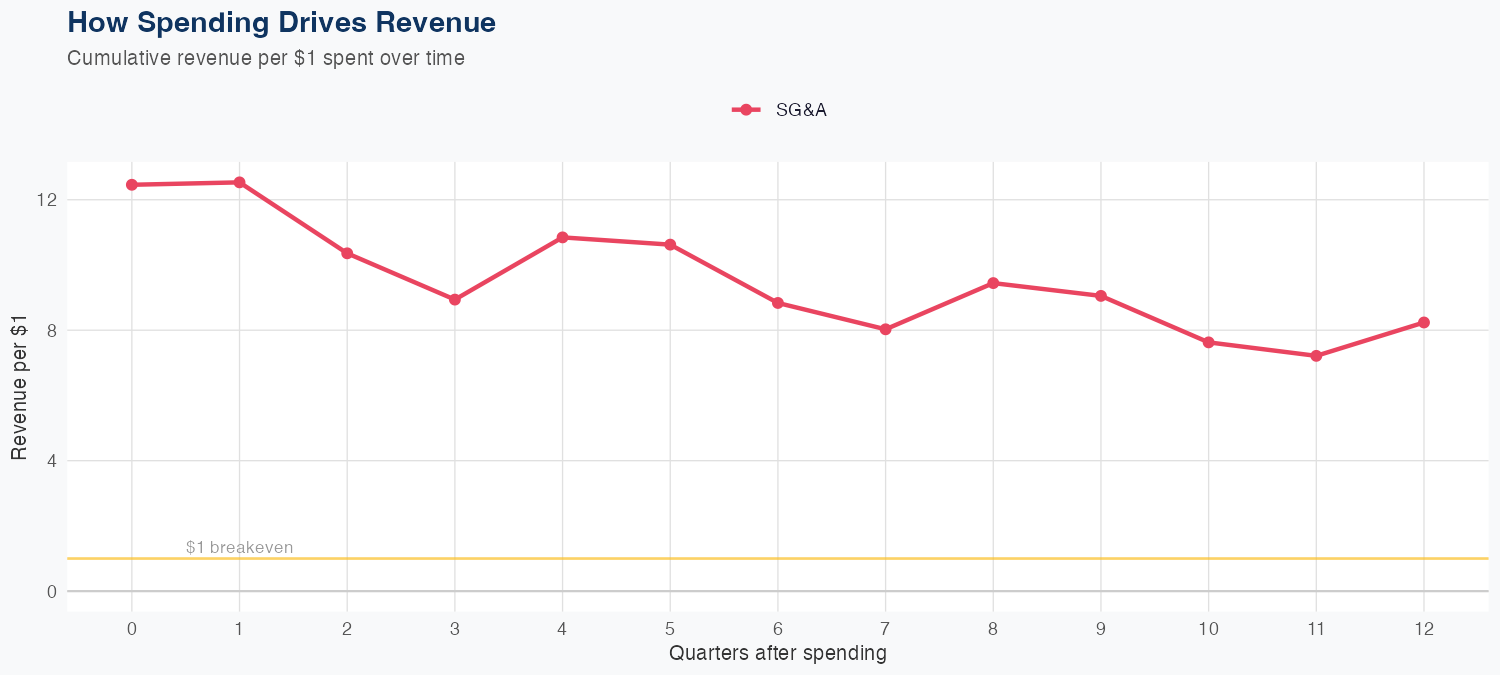
Latest quarterly revenue was about $982 million, and revenue growth appears driven by high operating leverage in SG&A, with $1 of SG&A spending generating $8.24 of long-run revenue, signaling a strong ROI from selling and administrative activity. The forecasting approach is a linear model with 5.9% MAPE; holdout tests yielded a 1.2B forecast vs 1.0B actual, a -23% error, indicating some risk to near-term accuracy. The full-year outlook calls for about $5.8B in revenue, up 9.4% year over year, pointing to solid growth momentum. Investors should monitor SG&A efficiency as the primary lever for revenue growth, while recognizing model and forecast risk that could temper quarterly results.
Investment Thesis
The econometric model achieves strong accuracy (5.9% MAPE), suggesting Pool Corporation's revenue trajectory is well-characterized by its spending patterns. Each $1 of SG&A spending generates $8.24 in revenue, reflecting strong commercial efficiency.
Revenue Forecast
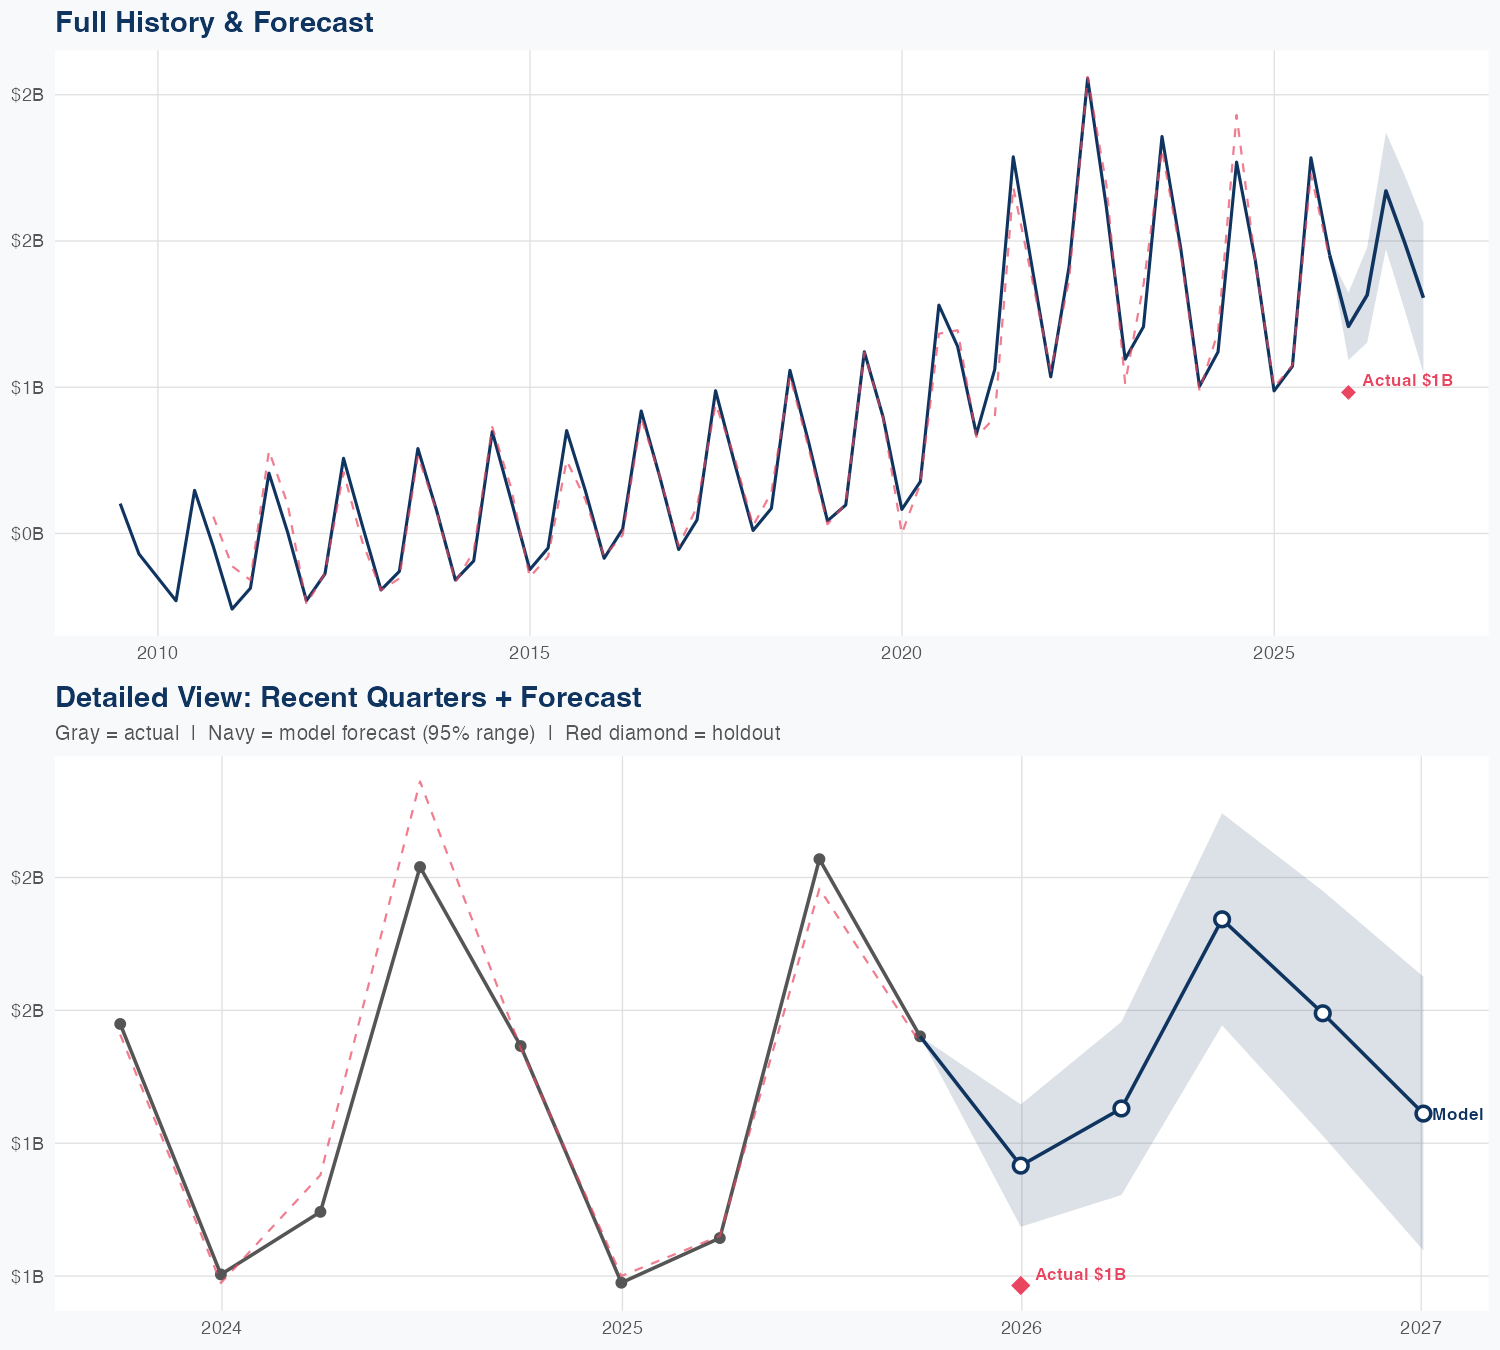
Quarterly Detail
| Quarter | Model Forecast | Actual | 95% Range | YoY Growth | Status |
|---|---|---|---|---|---|
| Q4 2025 | $1.2B | $1.0B | $1.1B – $1.3B | +22.3% | ✗ Outside range |
| Q2 2026 | $1.3B | $1.2B – $1.5B | +22.8% | ||
| Q3 2026 | $1.7B | $1.5B – $1.9B | -6.3% | ||
| Q4 2026 | $1.5B | $1.3B – $1.7B | +3.0% | ||
| Q1 2027 | $1.3B | $1.0B – $1.6B | +32.9% |
Seasonal Factors
| Fiscal Quarter | Seasonal Factor | vs Trend | Interpretation | Obs. |
|---|---|---|---|---|
| FQ1 (Sep–Nov) | 1.003 | +0.3% | In line with trend | 16 |
| FQ2 (Dec–Feb) | 1.0109 | +1.1% | In line with trend | 16 |
| FQ3 (Mar–May) | 0.9946 | -0.5% | In line with trend | 15 |
| FQ4 (Jun–Aug) | 1.0267 | +2.7% | In line with trend | 15 |
How Spending Drives Revenue
Want this analysis for your portfolio?
I build custom revenue intelligence reports for investors and companies using SEC filing data, econometric modeling, and AI-powered insights.
Get in Touch