Xylem Inc. XYL
Revenue Intelligence Report • 61 quarters of SEC filing data • Updated 2026-03-15
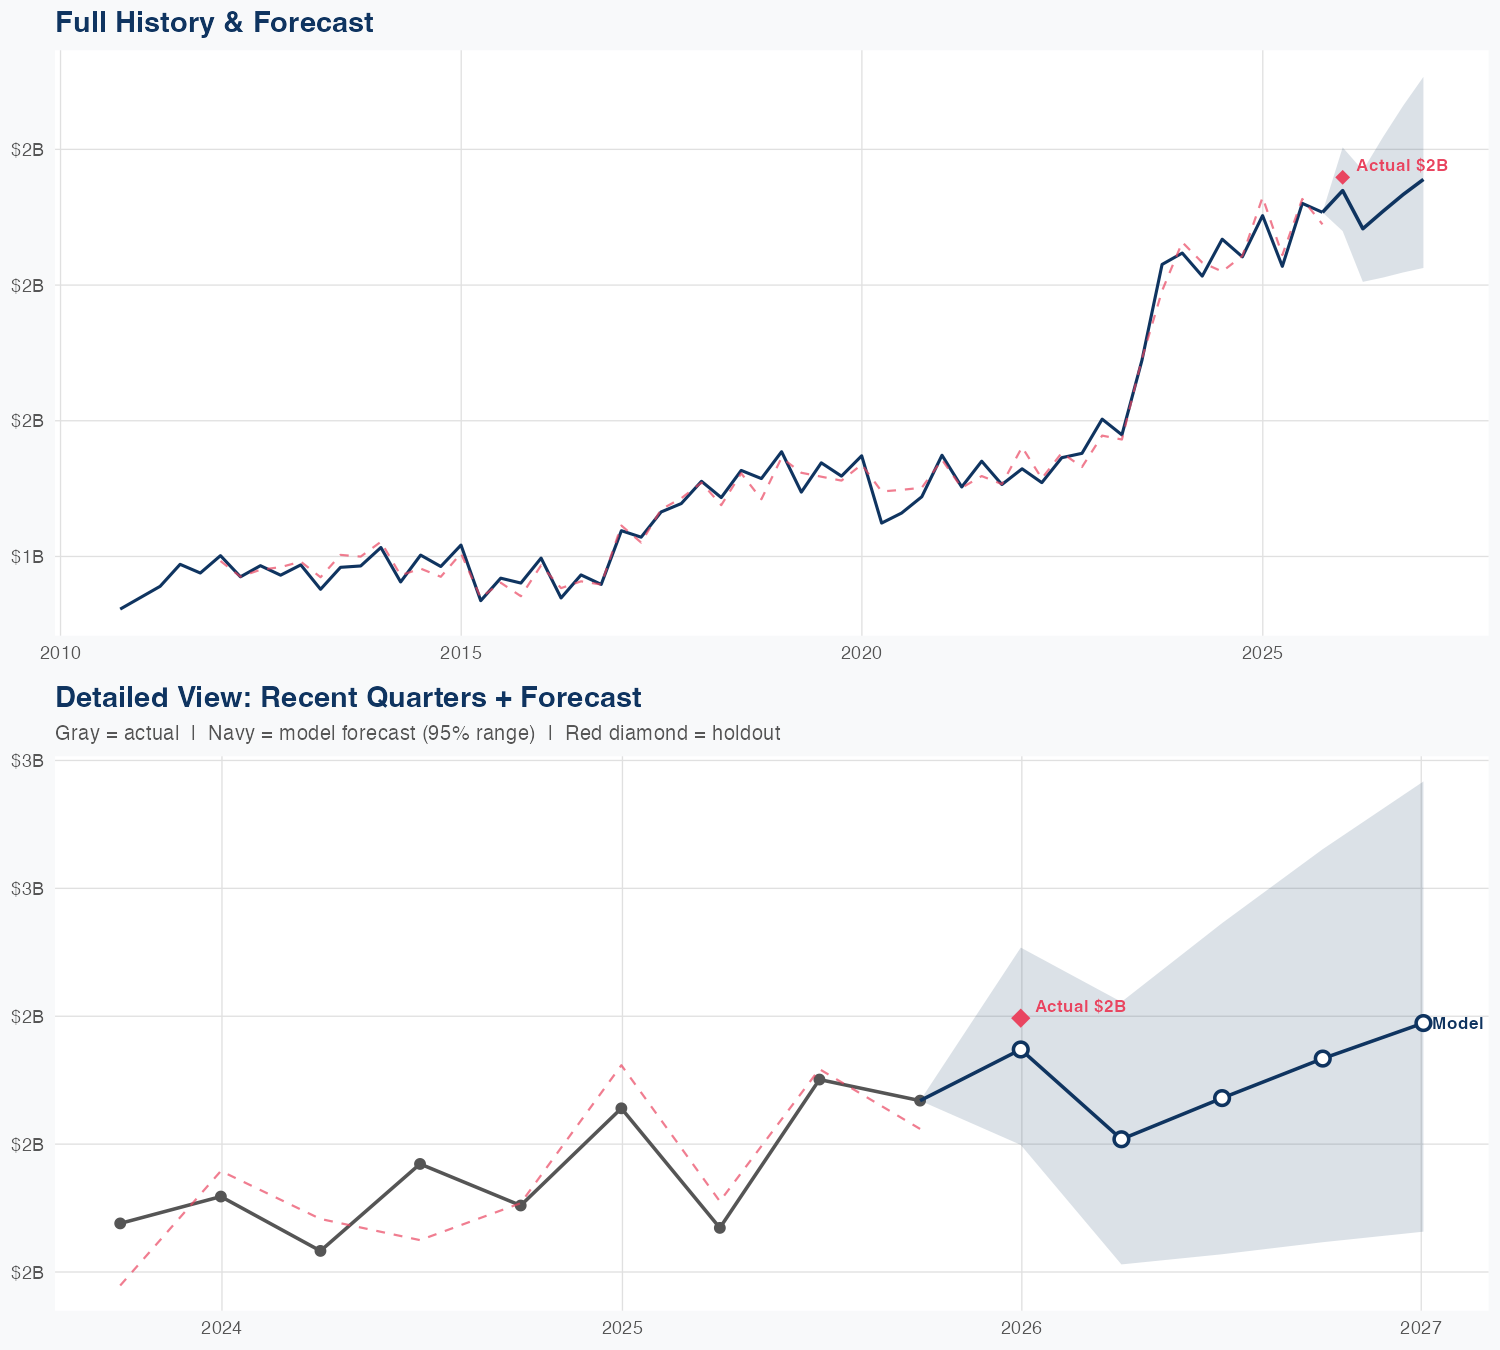
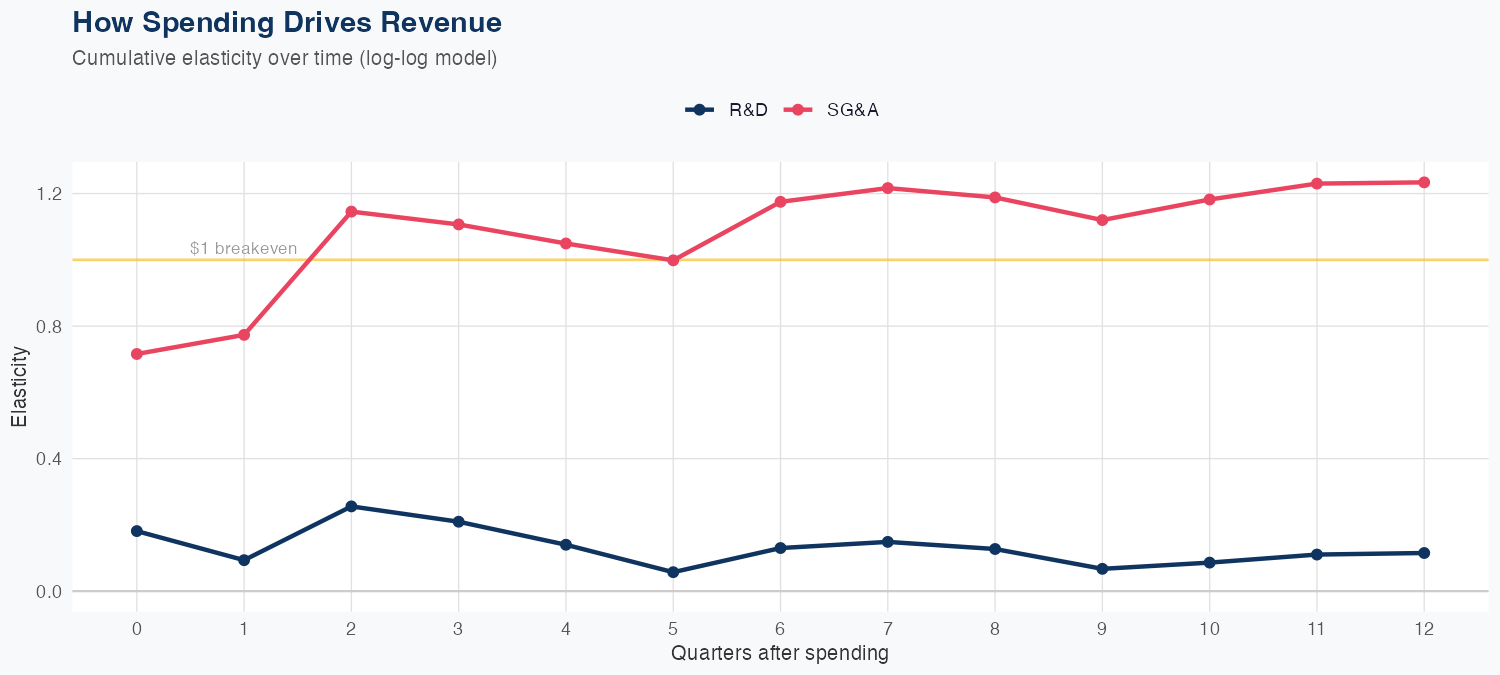
With quarterly revenue around $2.397 billion, the log-log model shows SG&A spending has the stronger revenue elasticity: a 1% increase in SG&A is associated with about a 1.23% rise in revenue, while a 1% increase in R&D yields roughly a 0.12% increase. The predictive performance is solid, evidenced by a holdout forecast of $2.30B versus $2.40B actual (about 2.0% error) and an overall MAPE of 2.7%. This points to a higher ROI on SG&A investments relative to R&D, suggesting near-term gains from optimizing SG&A spend while continuing selective R&D to sustain long-term growth. The FY revenue outlook is $9.2B, up about 1.9% year over year, signaling steady growth as the company balances efficiency with ongoing investments in its product roadmap.
Investment Thesis
Our ARDL model tracks Xylem Inc.'s revenue with exceptional precision (2.7% MAPE), indicating highly predictable cash flows. R&D investment shows a 0.12x multiplier — each 1% increase in R&D spend is associated with a 0.12% revenue increase, signaling strong innovation-to-revenue conversion. Sales & marketing spend shows a 1.23x elasticity, suggesting effective go-to-market execution.
Revenue Forecast
Quarterly Detail
| Quarter | Model Forecast | Actual | 95% Range | YoY Growth | Status |
|---|---|---|---|---|---|
| Q4 2025 | $2.3B | $2.4B | $2.2B – $2.5B | +4.1% | ✓ In range |
| Q2 2026 | $2.2B | $2.0B – $2.4B | +6.7% | ||
| Q3 2026 | $2.3B | $2.0B – $2.5B | -1.3% | ||
| Q4 2026 | $2.3B | $2.0B – $2.7B | +2.9% | ||
| Q1 2027 | $2.4B | $2.1B – $2.8B | -0.3% |
Seasonal Factors
| Fiscal Quarter | Seasonal Factor | vs Trend | Interpretation | Obs. |
|---|---|---|---|---|
| FQ1 (Sep–Nov) | 1.0129 | +1.3% | In line with trend | 14 |
| FQ2 (Dec–Feb) | 1.0038 | +0.4% | In line with trend | 15 |
| FQ3 (Mar–May) | 0.987 | -1.3% | In line with trend | 14 |
| FQ4 (Jun–Aug) | 1.0157 | +1.6% | In line with trend | 14 |
How Spending Drives Revenue
Want this analysis for your portfolio?
I build custom revenue intelligence reports for investors and companies using SEC filing data, econometric modeling, and AI-powered insights.
Get in Touch